Generating Menu Reports
Table Of Contents
Chapter 2. Ensure Your iPad Email Account is Set Up
Chapter 4. Generating a Report
Chapter 5. Menu Item List Report
Section 1. How is the Menu Item List Report Generated?
Chapter 6. Sales Item Totals Report
Section 2. How is the Sales Item Totals Report Generated?
Chapter 7. Cost of Goods Sold Report
Section 2. How is the Cost of Goods Sold Report Generated?
Section 2. How is a Modifier Report Generated?
1) Using and Setting Up Modifiers
Chapter 9. Inventory List Reports
Section 2. How is an Inventory List Generated?
1) Setting Up Menu Item Inventory Counts
Chapter 10. Low Inventory Totals Report
Section 2. How is a Low Inventory Totals Report Generated?
1) Setting Up Menu Item Inventory Counts
Chapter 1. Introduction
TouchBistro’s Menu Reports section allows you to generate reports about your menu items and products: break downs of sales by menu items, voids, food costs, and inventory reports.
Note: If you are using Inclusive Tax, see this discussion about how that effects reporting.
Chapter 2. Ensure Your iPad Email Account is Set Up
Many reports can only be viewed by emailing them to yourself as a CSV file. Before you start to generate reports, you should ensure you have an email account set up on your iPad(s). To set up an email account see this guide on the Apple site.
Chapter 3. Accessing Reports
To access a report login either as a manager profile or the admin profile. Best practices are not to use the admin login unless you need to access admin function to make permanent changes to your restaurant.
In this guide, we’ll assume you’re using a manager profile (or a profile that has Can Access Reports enabled).
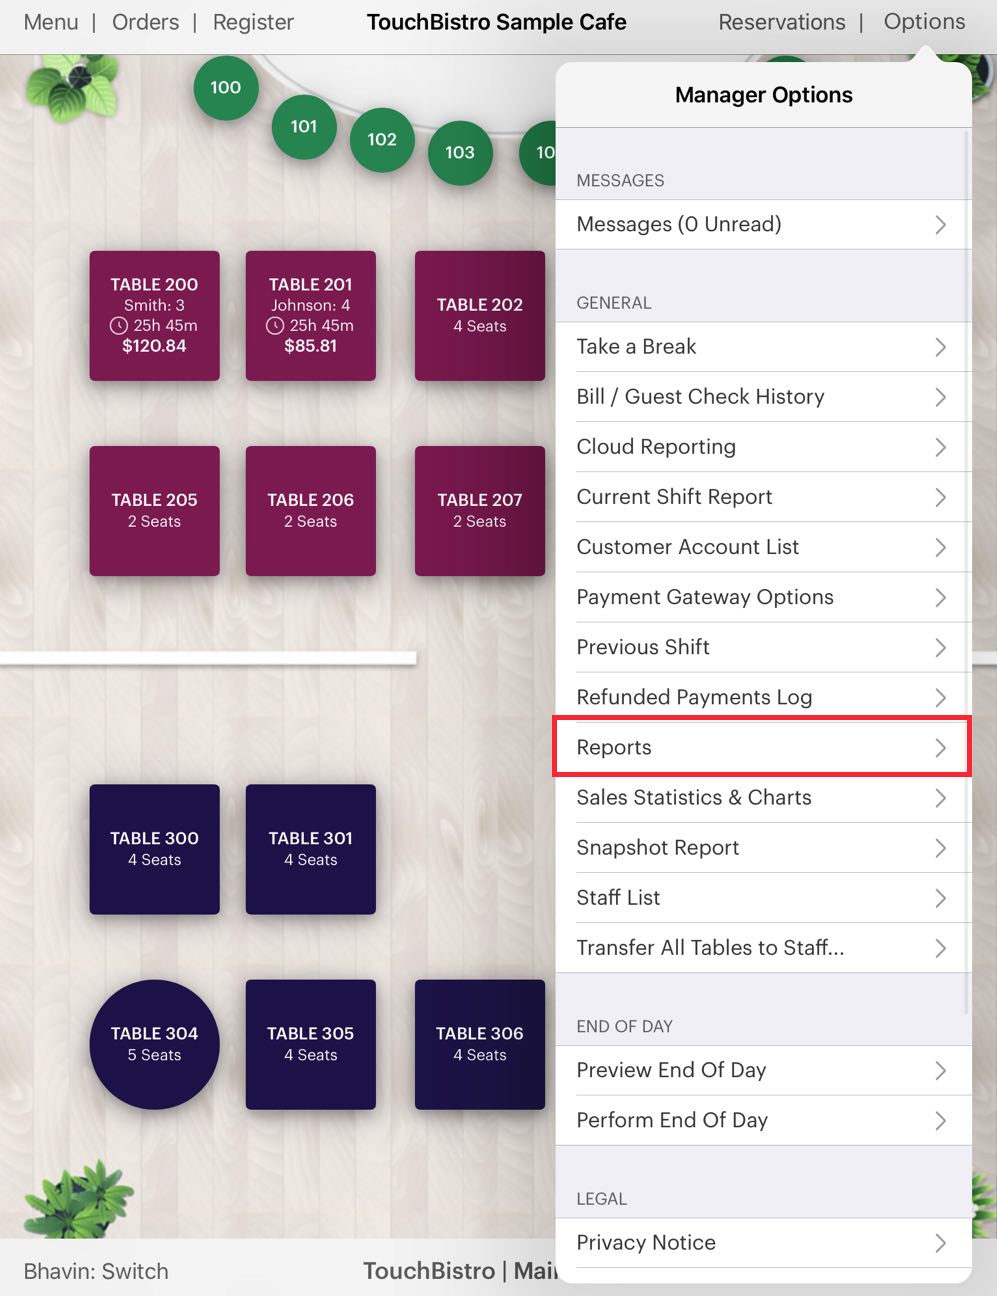
1. From your floor plan screen tap Options.
2. Tap Reports.
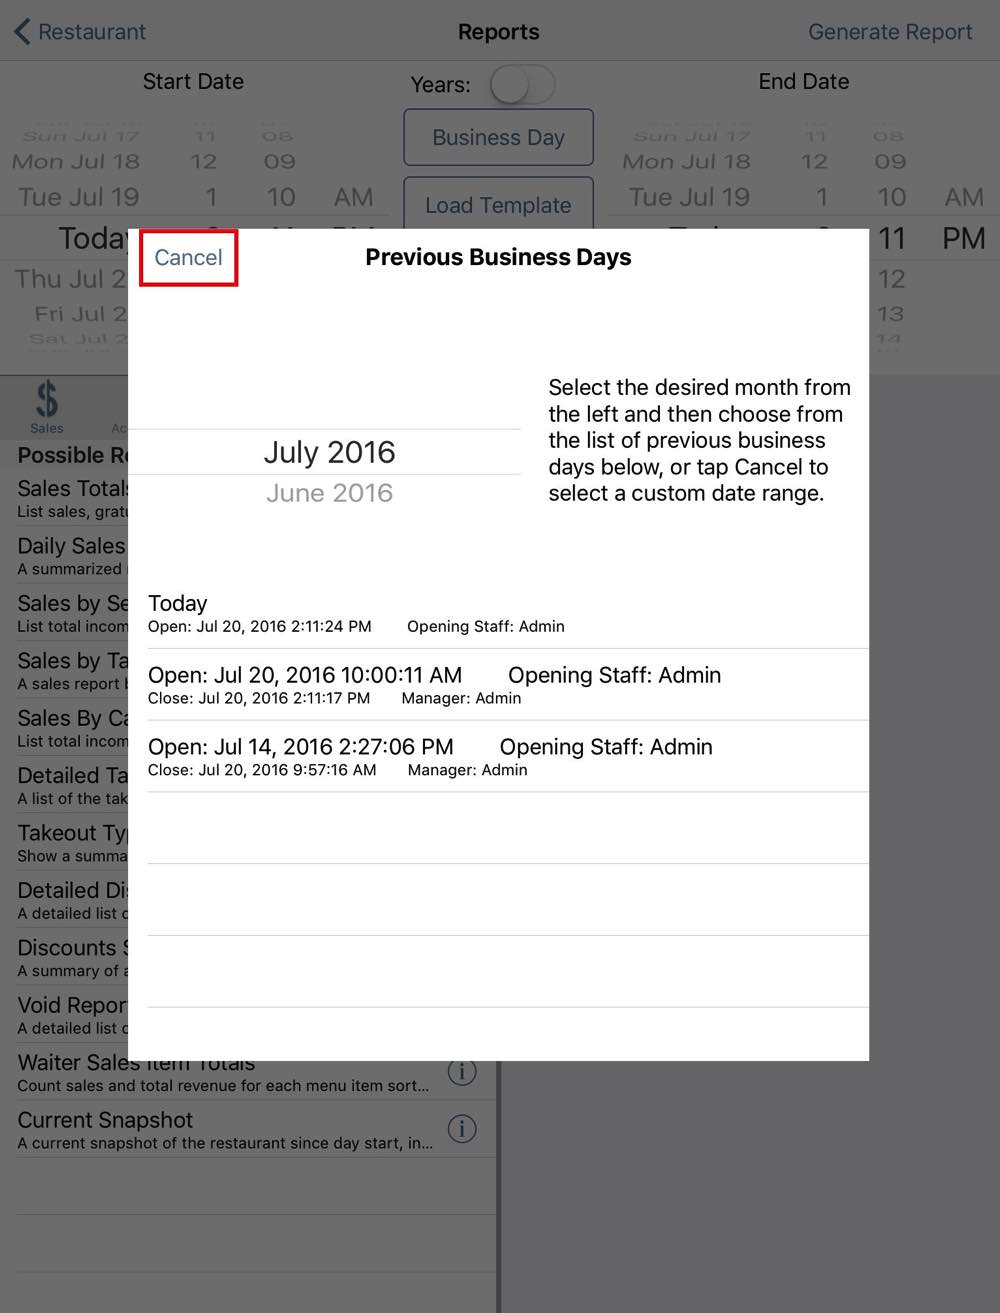
3. The Previous Business Days screen lets you quickly access individual business days (that is the block of time when you opened your venue via TouchBistro and when you closed it). Hence, a Business Day will not be 24 hours. If you opened your venue at TouchBistro at 9 am Tuesday and did your end of day and closed it Wednesday 3 am, TouchBistro will record that as a business day. In this example, we’re interested in a date range. We’ll generate a payments report for all staff for a week. Tap Cancel to set a date range.
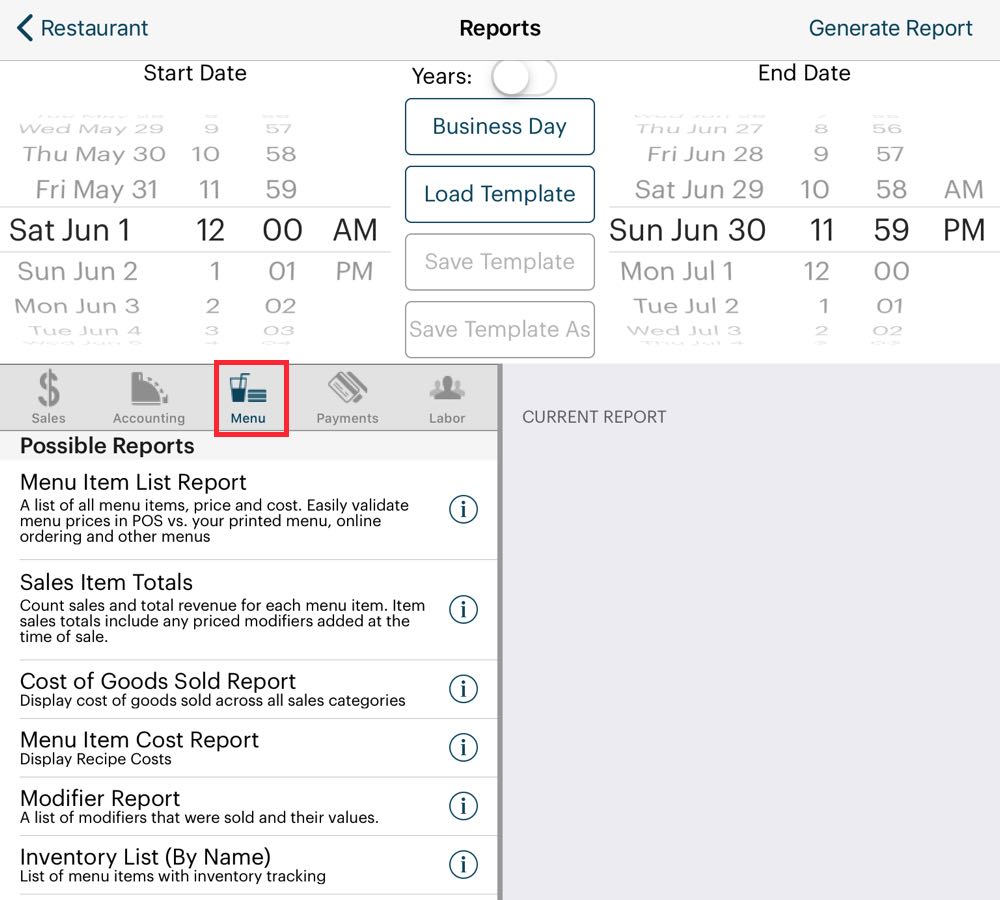
4. Use the date wheels at the top to set the start and end of the range. In this example, we’re setting the range from the very start of July 1 to the end of July 31. So, the whole month of July. TouchBistro treats 12:00 AM as the start of the day and 11:59 PM as the end of the day.
5. Tap Menu to access reports associated with your menu items and sales.
Chapter 4. Generating a Report
After determining the date range for the report, do the following:
 y
y
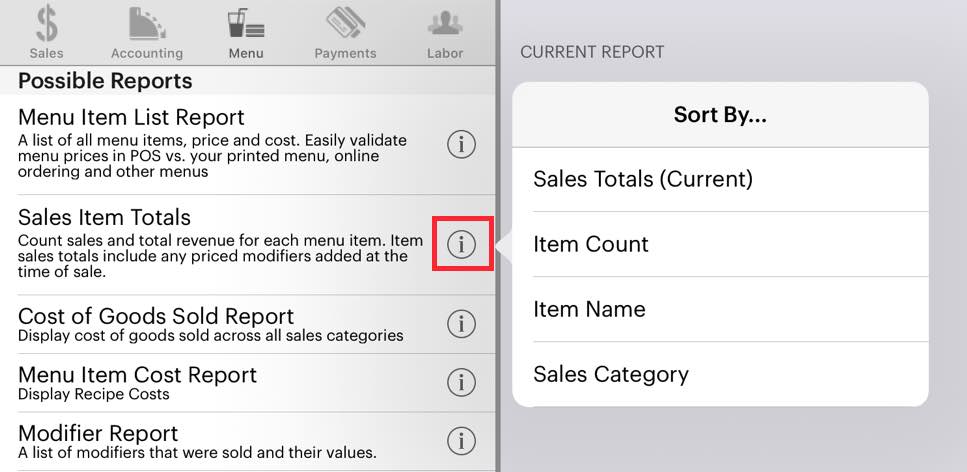
1. Before you add a report, tap the report’s Information ![]() icon associated with the report. Many reports let you change how the report is sorted. For example, the Sales Items Totals report lets sort by Sales Totals, Item Count, Item Name, or Sales Category.
icon associated with the report. Many reports let you change how the report is sorted. For example, the Sales Items Totals report lets sort by Sales Totals, Item Count, Item Name, or Sales Category.
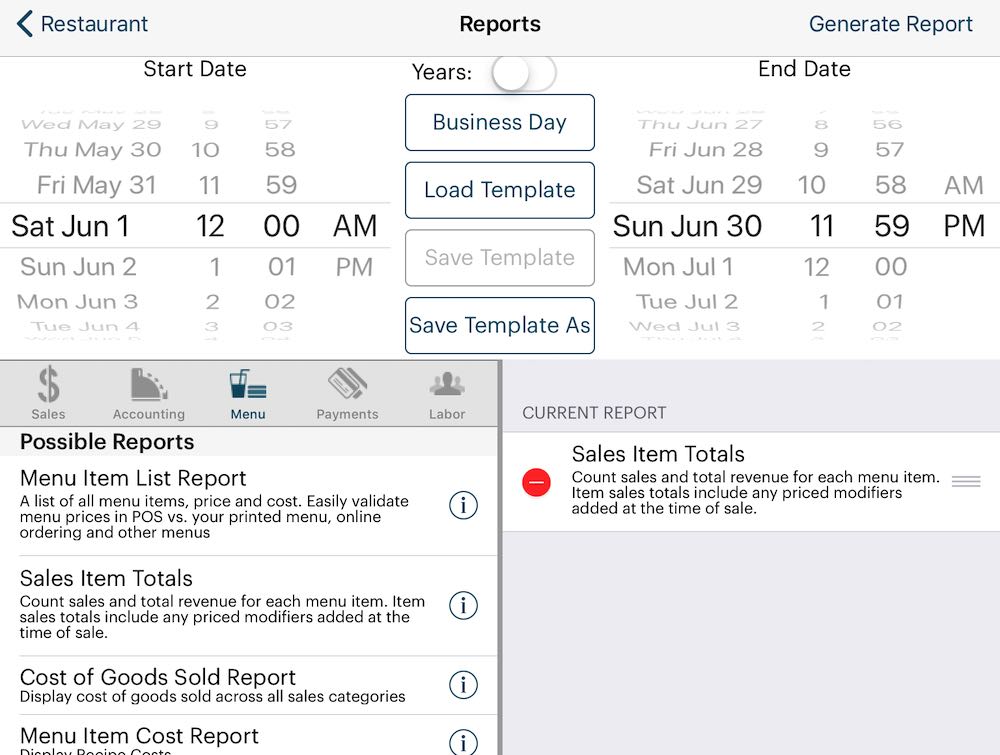
2. Tap the report to add it to the Current Report column.
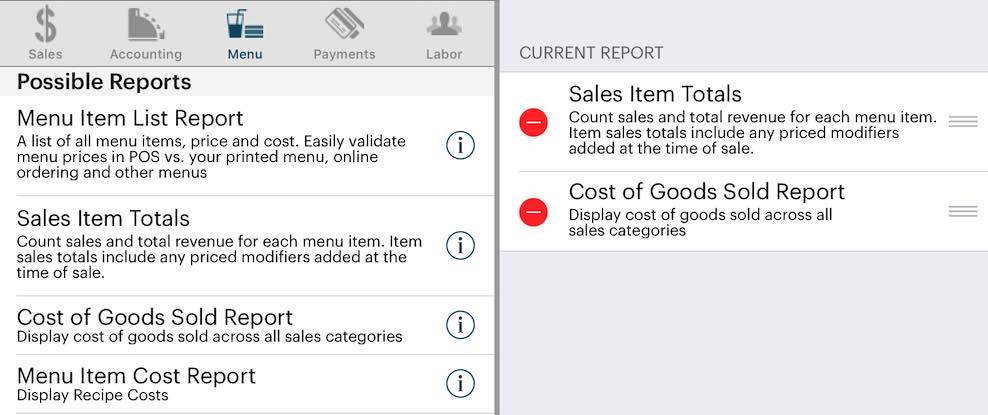
3. You can add in additional reports by tapping them. For example, tap Cost of Goods Sold Report.
4. You can remove a report at any time by tapping the Delete ![]() icon next to the appropriate report and then tapping Delete.
icon next to the appropriate report and then tapping Delete.
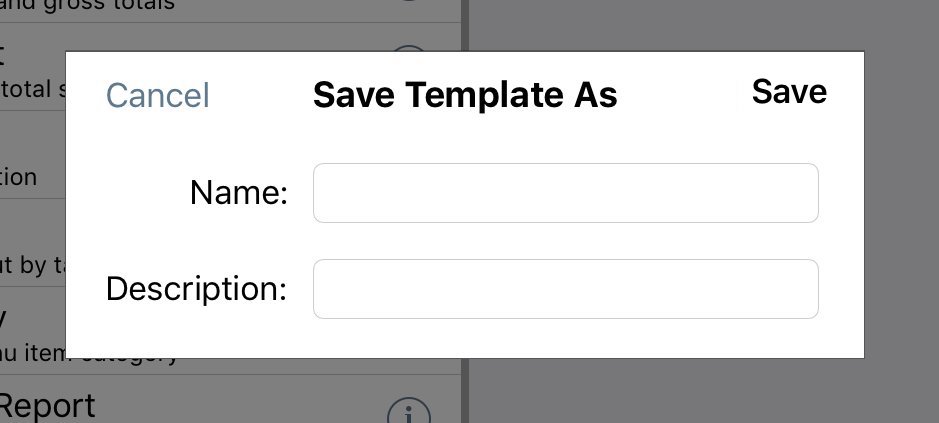
5. If you’ve created a report with multiple reports and you’ll need to re-generate the report at a later date, tap Save Template As. Use Load Template to access this saved report.
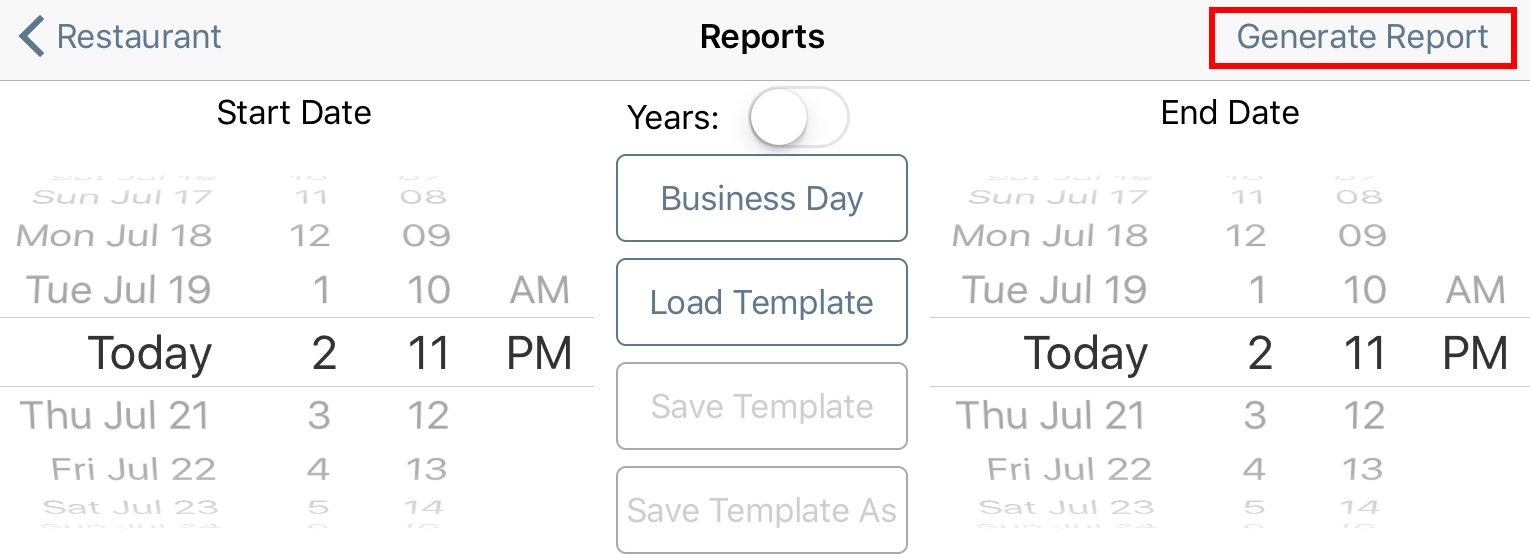
6. Tap Generate Report on the top right when you’re ready to view the report results.

7. When you generate a report, TouchBistro gives you the following options at the top of the report:
|
Option
|
Description
|
|
|
Tap CSV to email the report as a CSV (comma separated values) file. A CSV file can be opened in a spreadsheet.
|
|
|
Tap Email to email the report as a formatted email.
|
|
|
Tap Printer to print the report to a configured printer.
|
8. If you choose to email your report, ensure you’ve setup an email account under your iPad’s Settings. TouchBistro uses your iPad’s existing email credentials for emailing.
Chapter 5. Menu Item List Report

The Menu Item List Report lets you view (and export as CSV) a list of all your current menu items (grouped by Menu Category), their current menu prices, and their costs. You can use this report to quickly verify the menu item prices as well as see menu items that lack food cost details or have unusually high/low food costs. As well, this report can be useful if you need to export your menu and prices. For example, you want to use the raw export text as the basis for a printed menu or for posting online.
Note: This report will only generate a menu item list for your current menu. If you set the date/time wheels to a previous date range, this report will not show old menu items (which have been archived), or previous menu item costs, and prices.
Section 1. How is the Menu Item List Report Generated?
1) Price
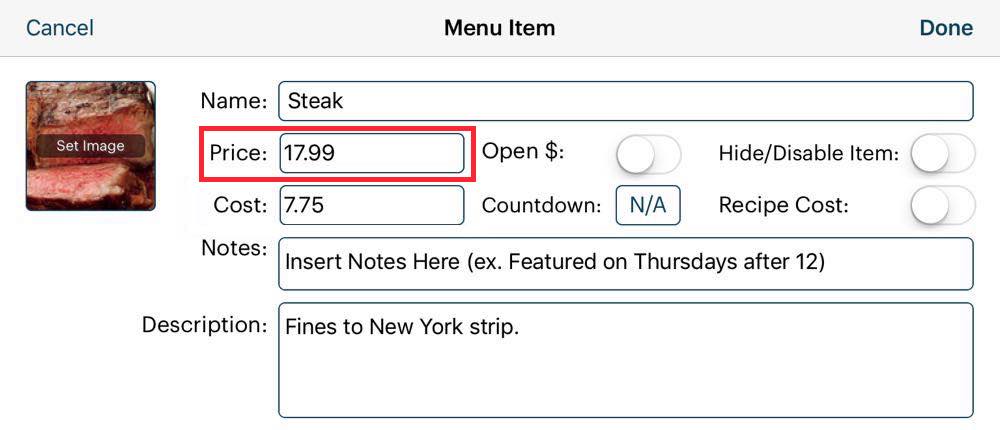
When you edit a menu item, you can enter the item’s price. The Menu Item List Report uses this figure to report on the item’s price.
2) Cost
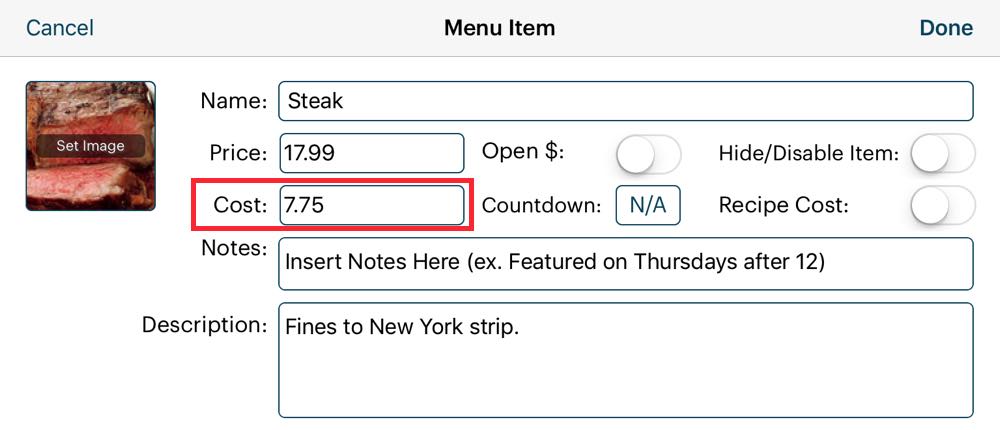
When you edit a menu item, you can enter the item’s cost. The Menu Item List Report uses this figure to calculate total costs. If you later change the cost figure (because, for example, your cost of steak has gone up), TouchBistro will not retroactively recalculate the food or alcohol cost based on the new figure. Your reports will properly reflect the costs as entered for the given time period.
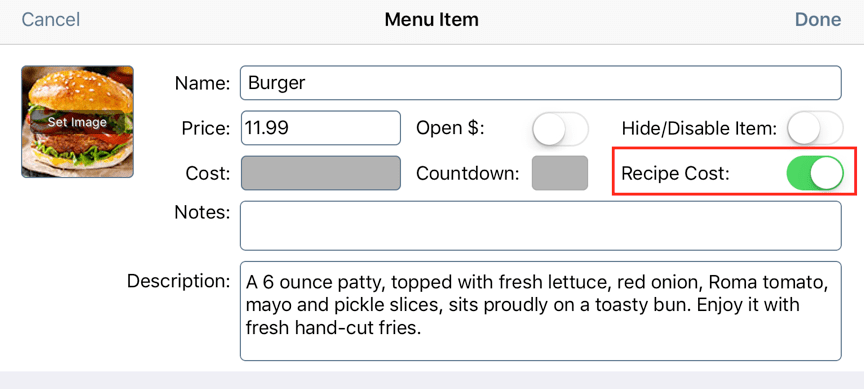
If you are using the Ingredient Inventory System and you’ve enabled Recipe Cost, TouchBistro will calculate the menu item’s cost based on your recipe and ingredient prices.
Chapter 6. Sales Item Totals Report
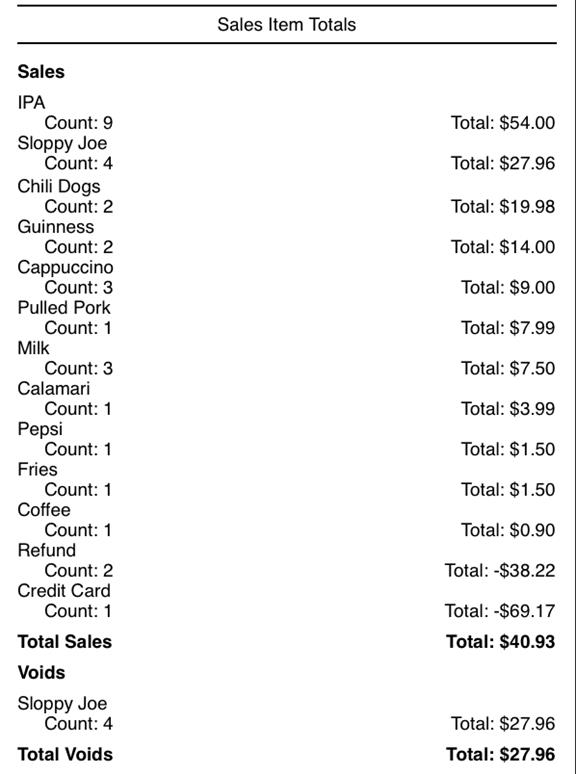
The Sales Item Totals report will give you a breakdown of all menu items, how many times each menu items was ordered, and the total gross revenue of each menu item. Items flagged as returnable will show return counts. It will also report a breakdown of voids.
Section 1. Sort By
|
Option
|
Description
|
|
Sales Totals
|
Sorts sales from highest grossing menu item to the lowest.
|
|
Item count
|
Sorts sales from the most sold menu item to the least sold.
|
|
Item Name
|
Sorts menu items alphabetically.
|
|
Sales Category
|
Sorts menu items by their sales category and identifies which sales category the item belongs to.
|
Section 2. How is the Sales Item Totals Report Generated?
The Sales Item Totals Report combines data from three sources:
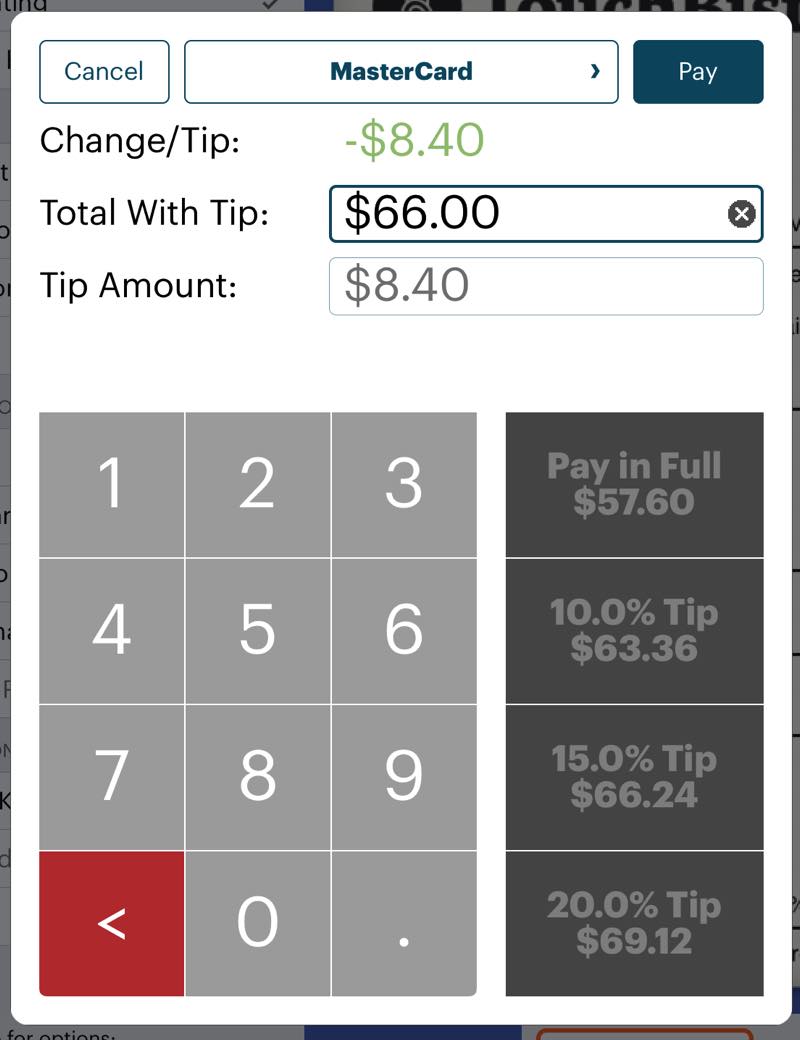
Menu items sales counts and totals flow from your closed bills. Totals are before tax.
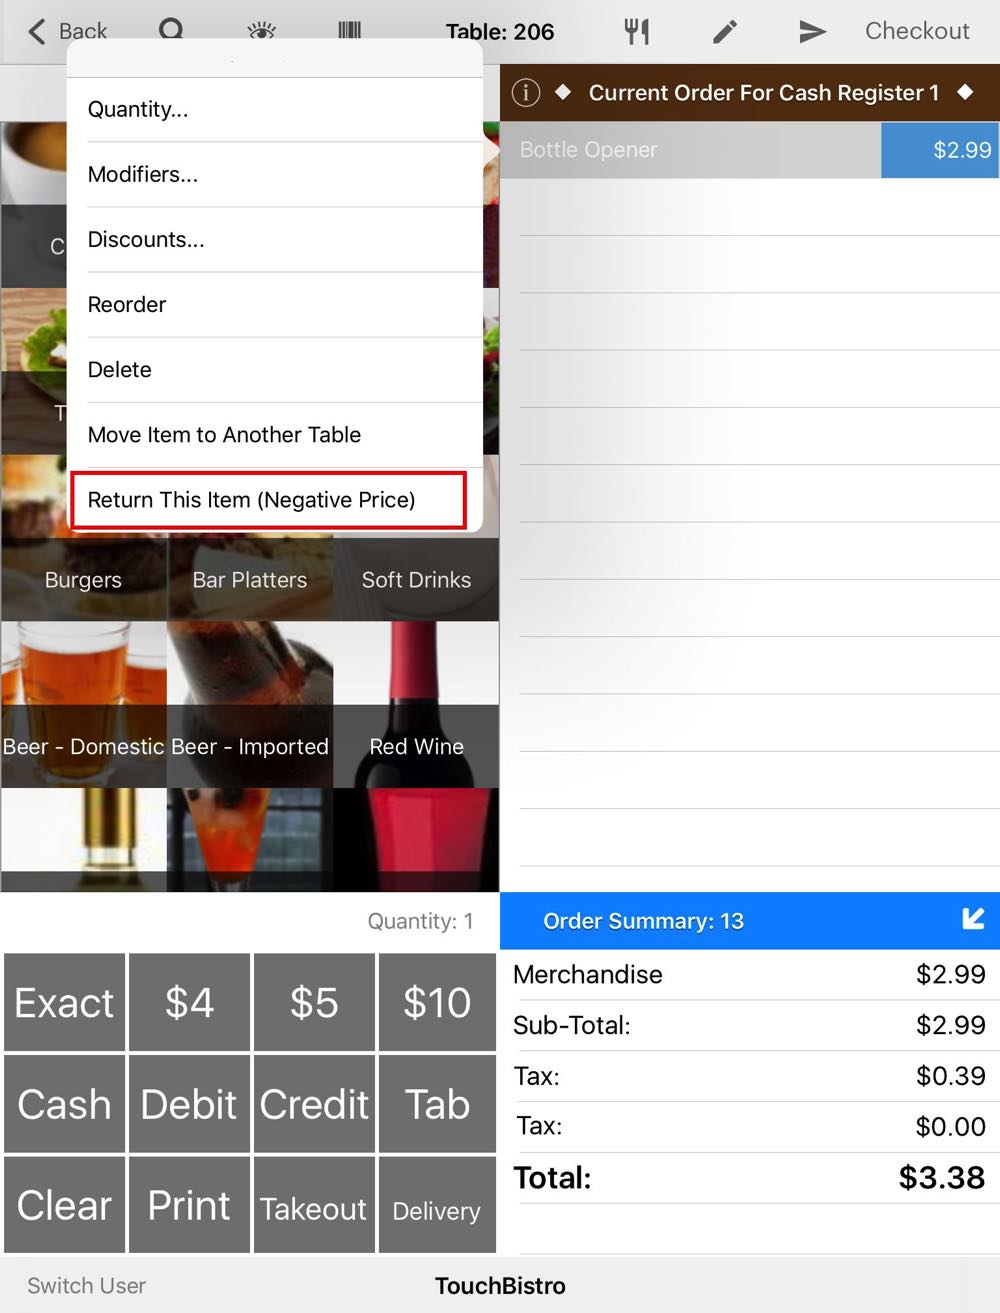
On an item you’ve flagged as Allow Returns, you can tap the item and then tap Return This Item (Negative Price) to process a cash or credit card return. You have to explicitly flag menu items as being returnable in Admin | Admin Settings | Menu | Menu Items.

Voids are items canceled after being sent to the kitchen. Voided items do not calculate into menu item totals.
Chapter 7. Cost of Goods Sold Report
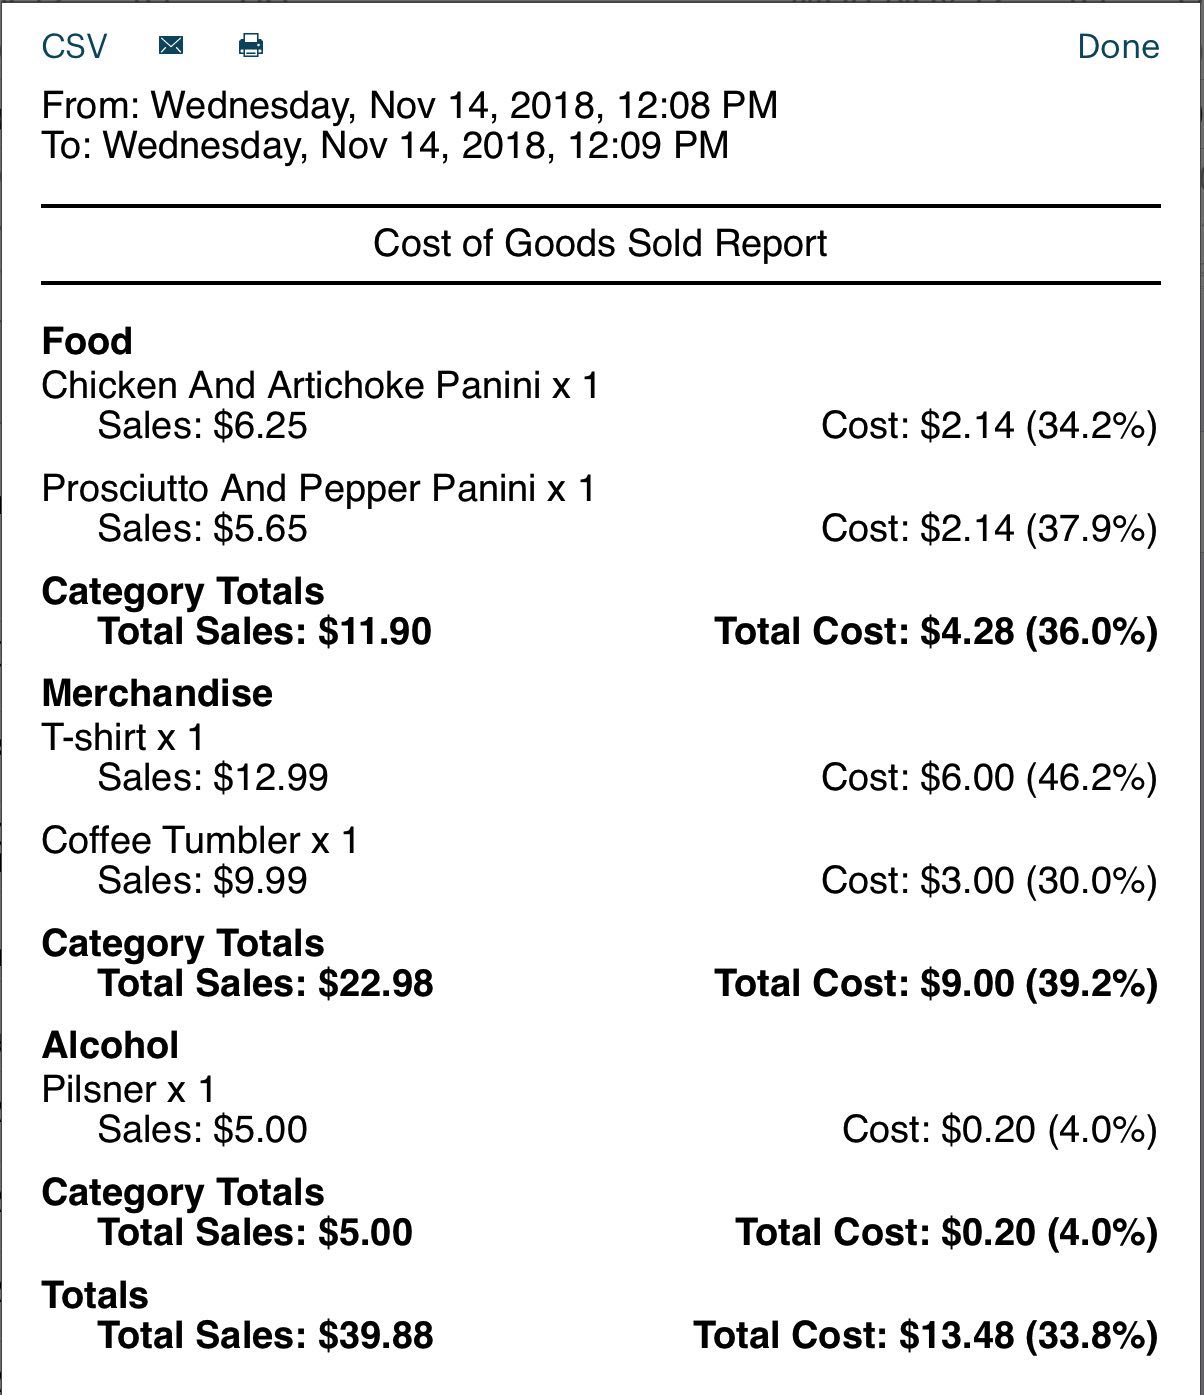
The Cost of Goods Sold Report will break out costs via their Sales Category and give you an overall sales vs item cost calculation. Voided items are not included in this report.
Section 1. Sort by

Before you add a Cost of Goods Sold report, tap the Information ![]() icon associated with the report to specify the sort order:
icon associated with the report to specify the sort order:
|
Option
|
Description
|
|
Sales Totals
|
Sorts sales from highest grossing menu item to the lowest.
|
|
Item Name
|
Sorts menu items alphabetically.
|
Section 2. How is the Cost of Goods Sold Report Generated?
1) Closed Bills
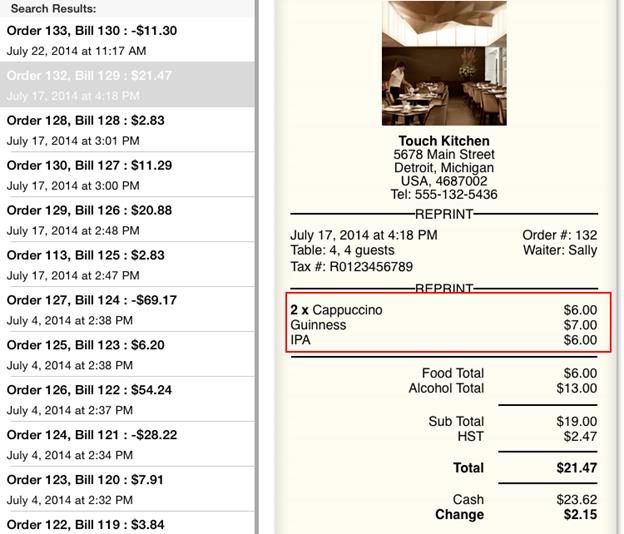
Menu items sales counts and totals flow from your closed bills. Totals are before tax.
2) Menu Items Costs

When you edit a menu item, you can enter the item’s cost. The Cost of Goods Sold report uses this figure to calculate total costs. If you later change the cost figure (because, for example, your cost of steak has gone up), TouchBistro will not retroactively recalculate the food or alcohol cost based on the new figure. Your reports will properly reflect the costs as entered for the given time period.

If you are using the Ingredient Inventory System and you’ve enabled Recipe Cost, TouchBistro will calculate the menu item’s costs based on your recipe and ingredient prices.
Chapter 8. Modifier Report
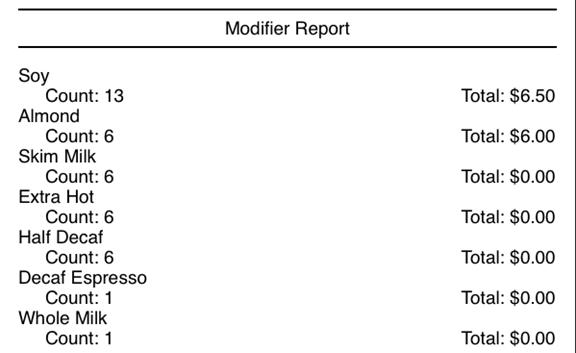
The Modifier Report gives you a breakdown of which Text modifiers are being used and how often. If modifiers come with an extra charge, the report will display how much money was earned from the modifier. This report can be useful for determining top selling and poor selling modifications and adjusting your modification options.
Note: this report does not report on Menu Item modifiers.
Section 1. Sort by
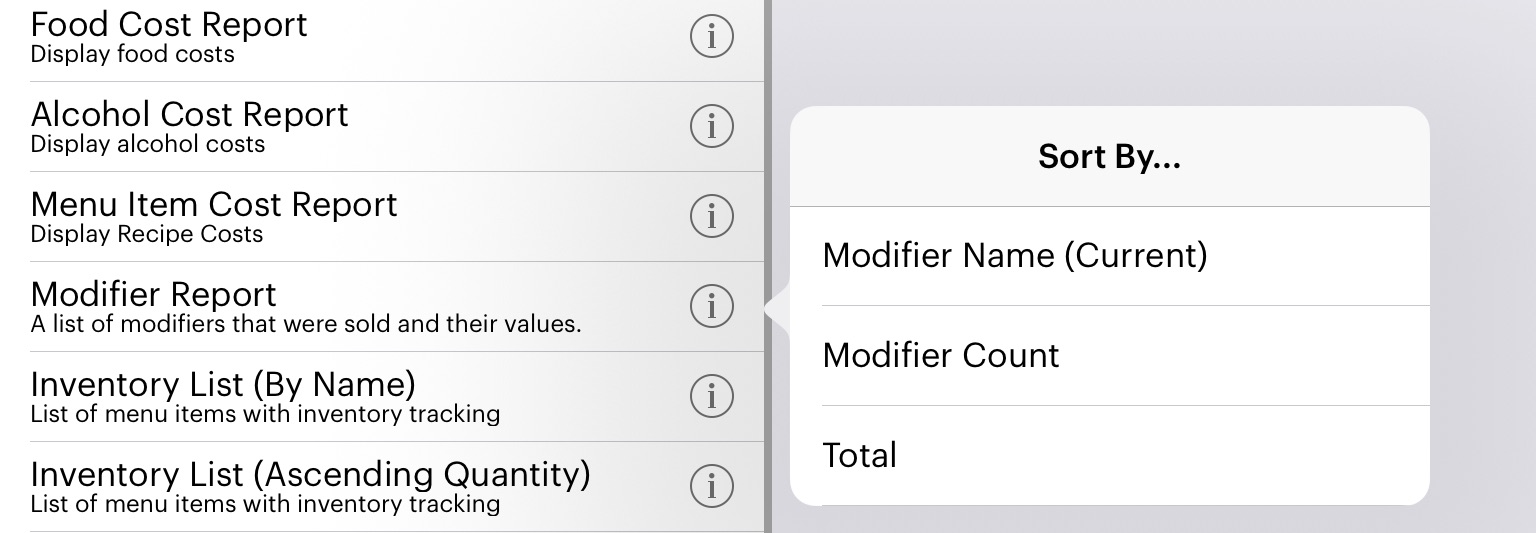
Before you add a Modifier report, tap the Information ![]() icon associated with the report to specify the sort order:
icon associated with the report to specify the sort order:
|
Option
|
Description
|
|
Modifier Name
|
Sort modifiers alphabetically.
|
|
Modifier Count
|
Sort by most popular modifier to least popular.
|
|
Total
|
Sort by modifier with the highest gross.
|
Section 2. How is a Modifier Report Generated?
1) Using and Setting Up Modifiers
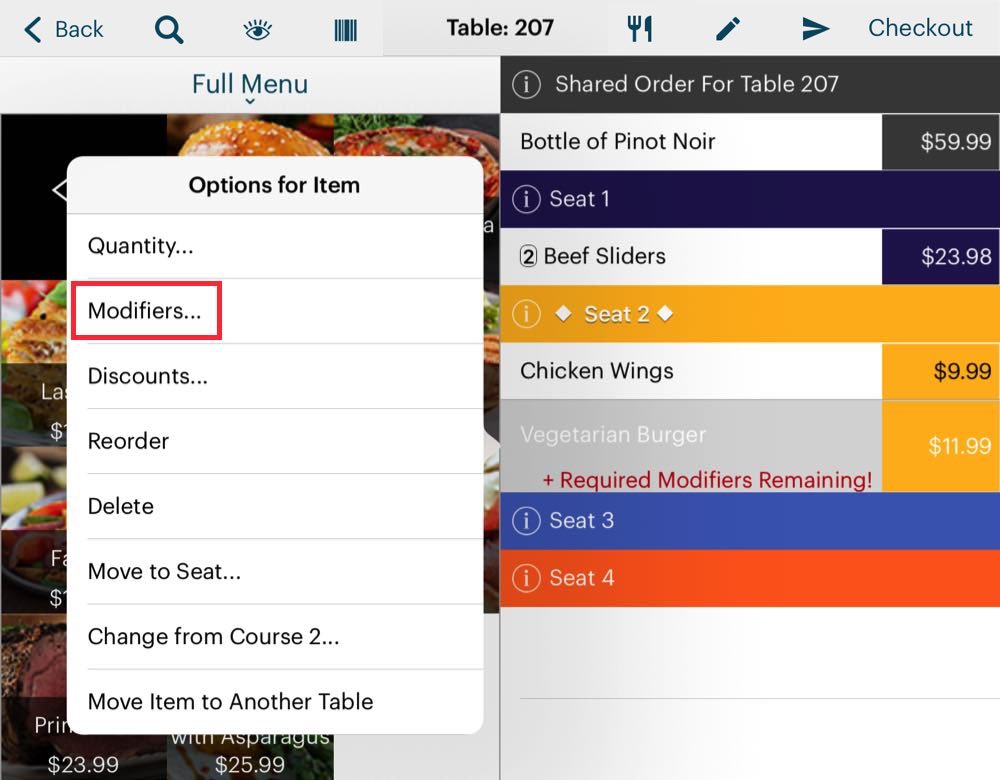
This report tracks modifiers applied to menu items in the order screen.
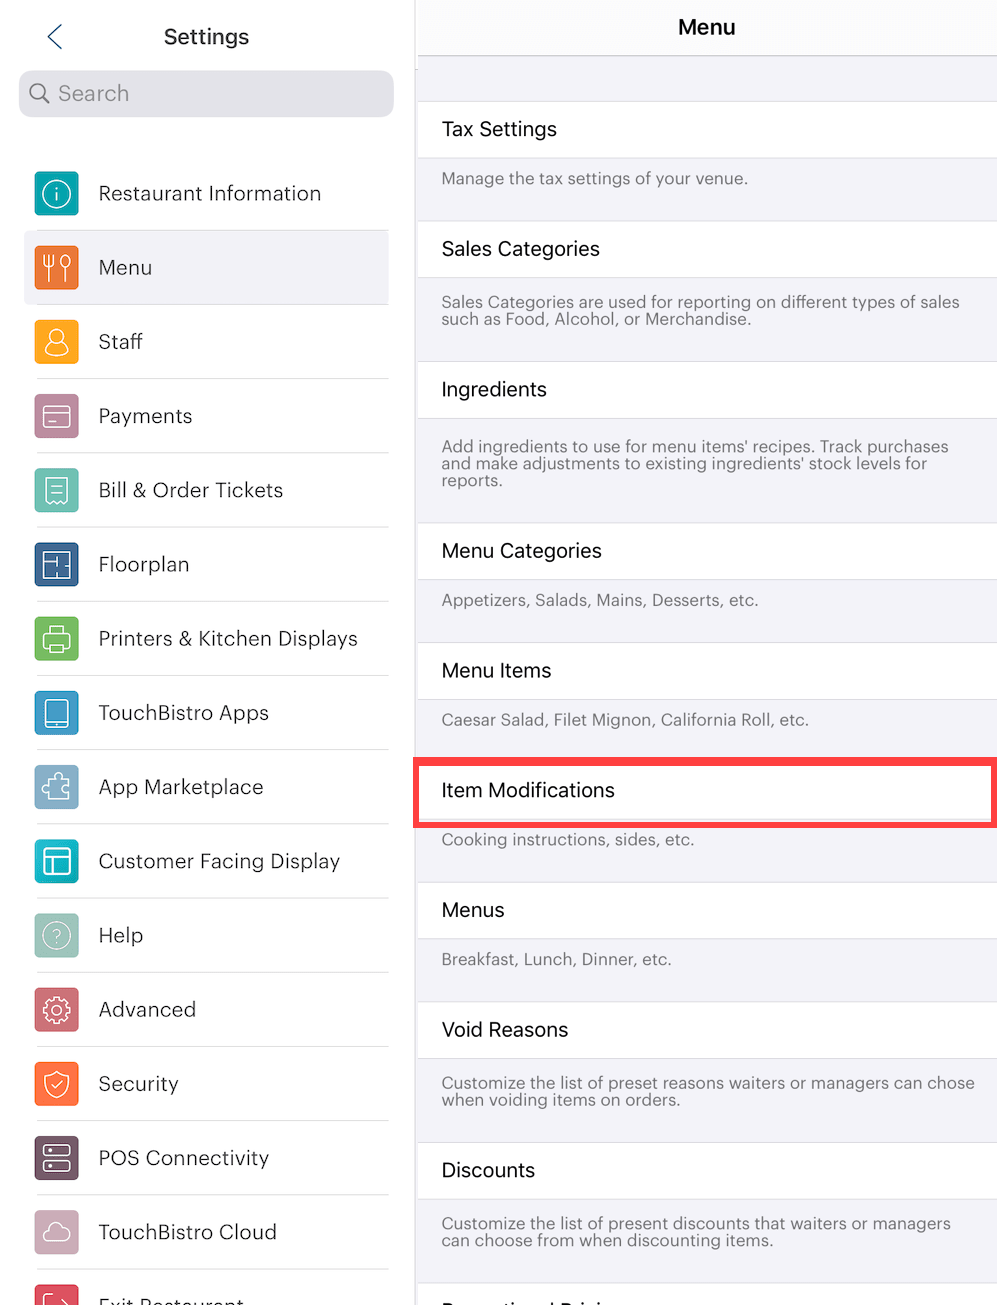
Modifiers are added under Admin | Admin Settings | Menu.
Chapter 9. Inventory List Reports
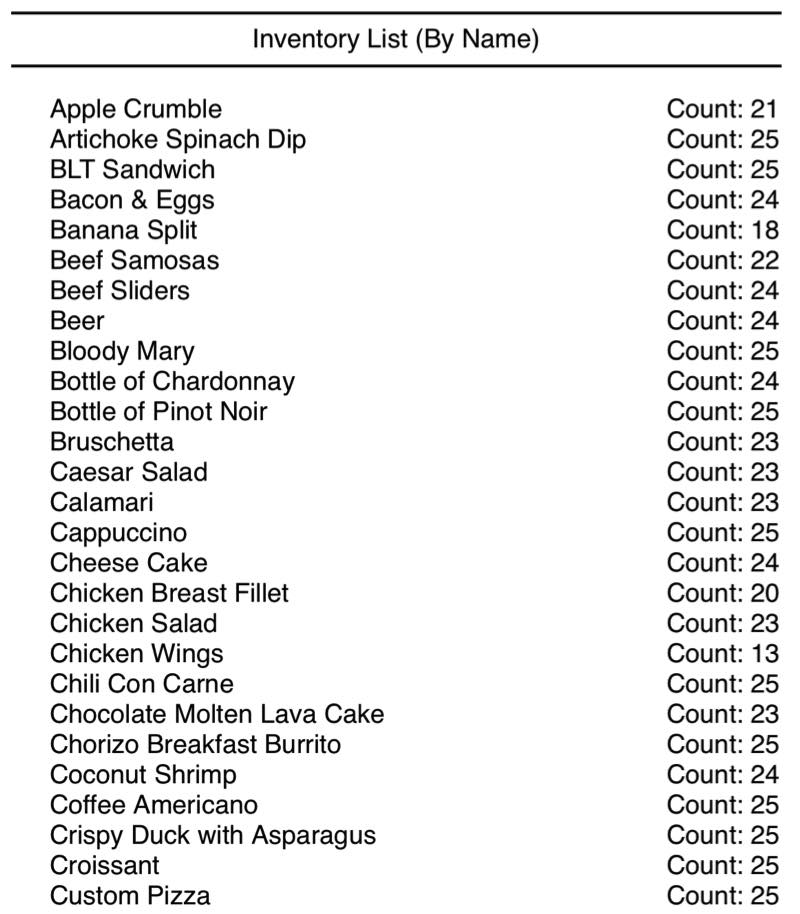
The Inventory List report gives you a breakdown of menu items you’re tracking in inventory. It shows how many items remain.
Section 1. Sort by
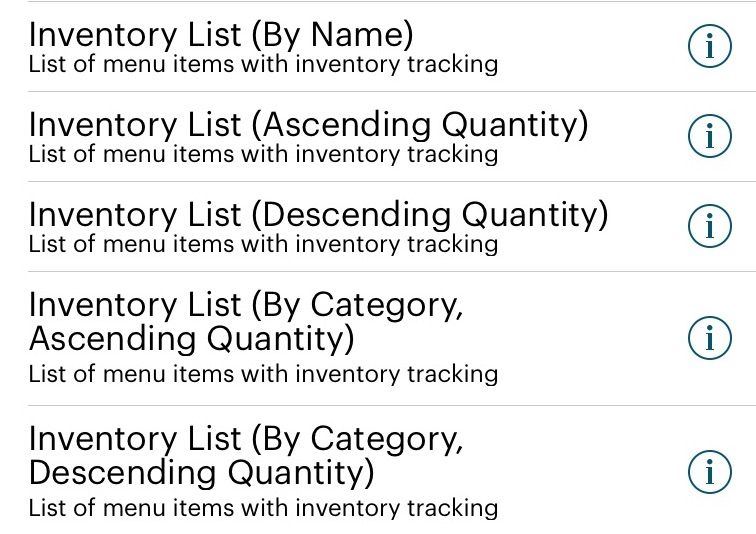
Sorting results is typically done with the report’s associated Information ![]() icon. However, sorting for Inventory List reports is done by simply selecting the report with the specific sort order. Unlike other reports, you can actually add several inventory sorts to your report.
icon. However, sorting for Inventory List reports is done by simply selecting the report with the specific sort order. Unlike other reports, you can actually add several inventory sorts to your report.
Section 2. How is an Inventory List Generated?
1) Setting Up Menu Item Inventory Counts
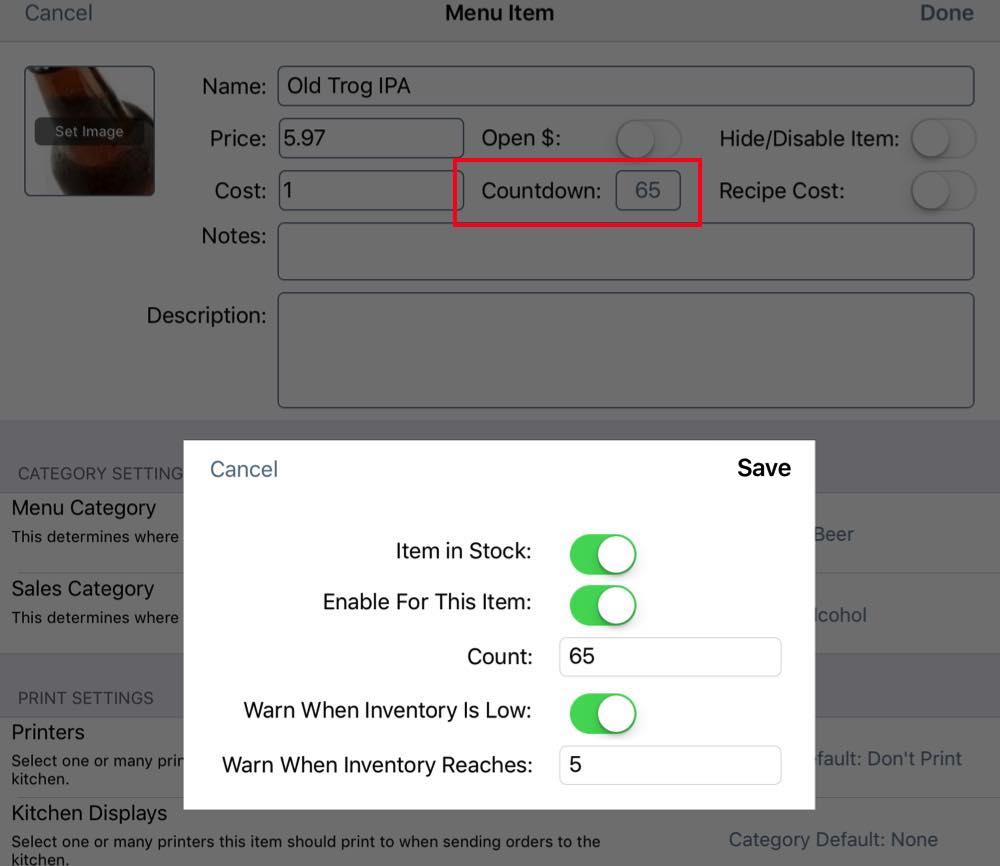
Initial inventory numbers for any given menu item are entered under Admin | Admin Settings | Menu | Menu Item. Inventory numbers are set by tapping the Countdown button. As items are ordered via the order screen, the count is decreased appropriately.
Chapter 10. Low Inventory Totals Report
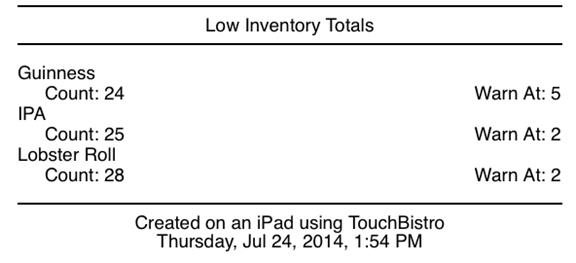
The Low Inventory Totals report shows you menu item inventory counts and their corresponding “low inventory” warning setting.
Section 1. Sort by

Before you add a Low Inventory Totals report, tap the Information ![]() icon associated with the report to specify the sort order:
icon associated with the report to specify the sort order:
|
Option
|
Description
|
|
Item Name
|
Sort menu items alphabetically.
|
|
Item Count
|
Sort by menu item from the highest “Warn at” setting to the lowest.
|
Section 2. How is a Low Inventory Totals Report Generated?
1) Setting Up Menu Item Inventory Counts

Initial inventory numbers for any given menu item are entered under Admin | Admin Settings | Menu | Menu Item. Inventory numbers are set by tapping the Countdown button. The Warn At setting is likewise set when you’re setting initial inventory numbers. This number remains unchanged unless you alter it.
Chapter 11. Sales by Menu
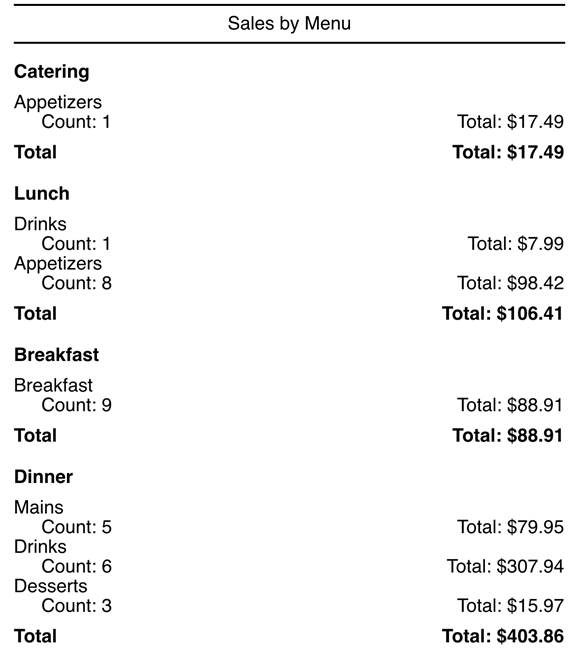
The Sales by Menu report shows you a breakdown of menu categories ordered by Menu.
Section 1. Sort by
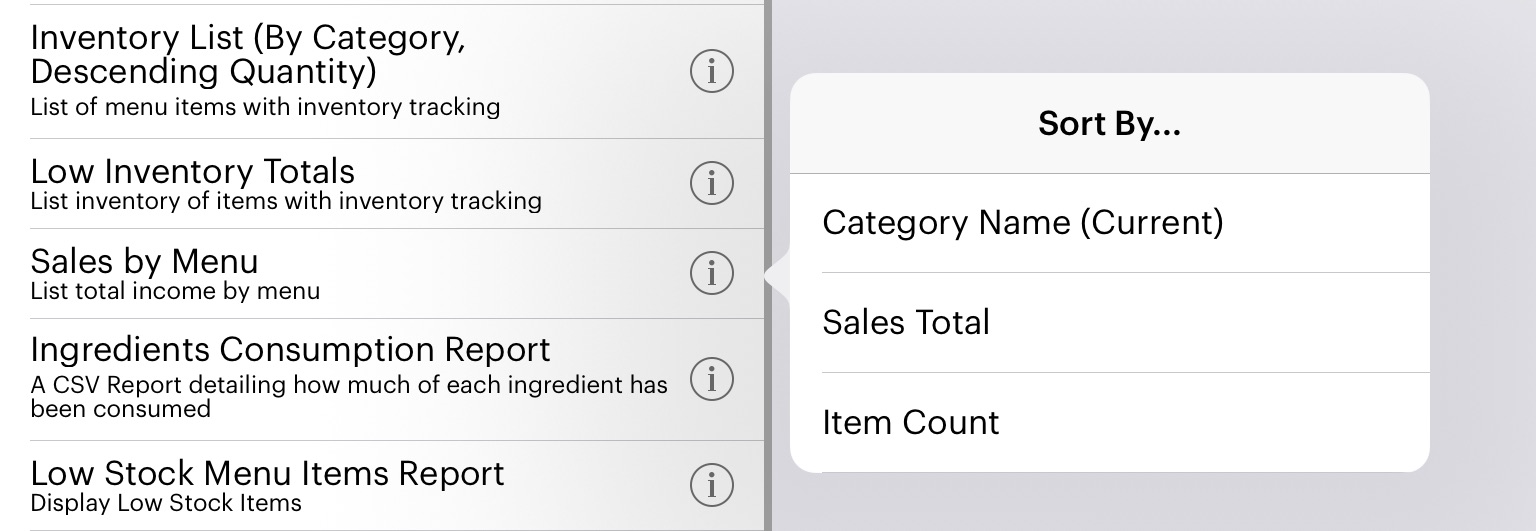
Before you add a Sales by Menu report, tap the Information ![]() icon associated with the report to specify the sort order.
icon associated with the report to specify the sort order.
|
Option
|
Description
|
|
Menu
|
Sorts alphabetically by Menu.
|
|
Sales Total
|
Sorts by sales totals, from highest grossing Menu to lowest..
|
|
Item Count
|
Sorts sales from the most sold Menu with most sold menu category items to the least sold.
|
Section 2. How is the Sales by Menu Report Generated?
1) Menus
When items are order, TouchBistro will record which Menu they were order under.
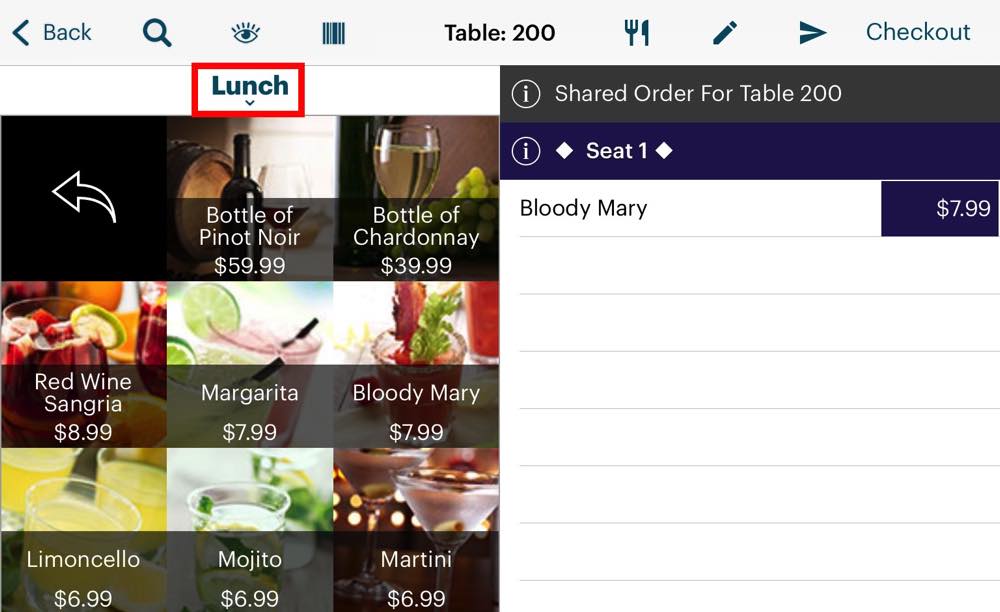
For example, imagine an item (e.g., a Bloody Mary) was ordered from the Drinks category under the lunch menu.
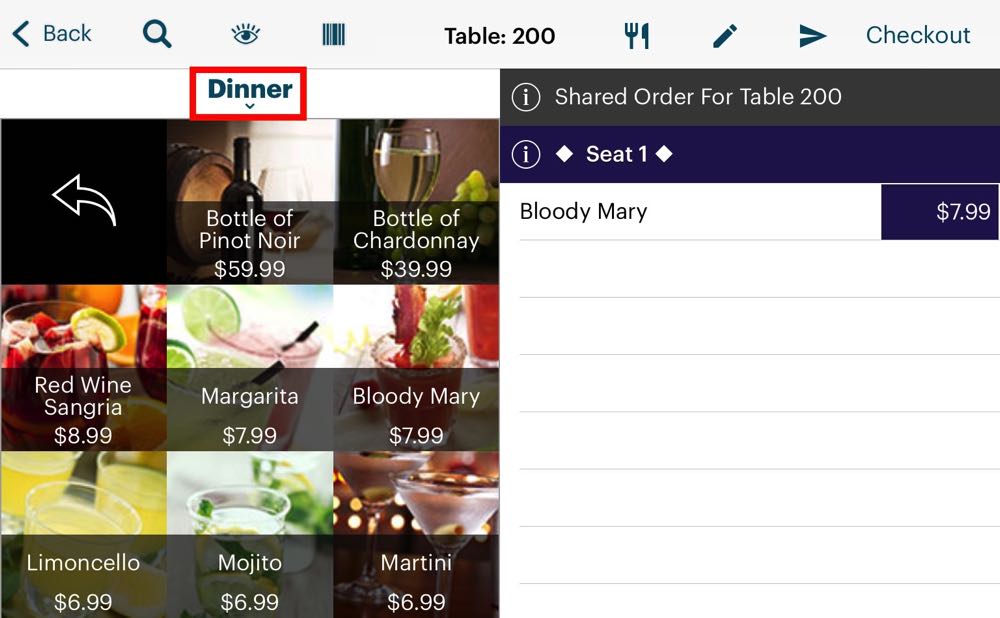
Later that night an item was ordered from the Drinks category under the dinner menu.
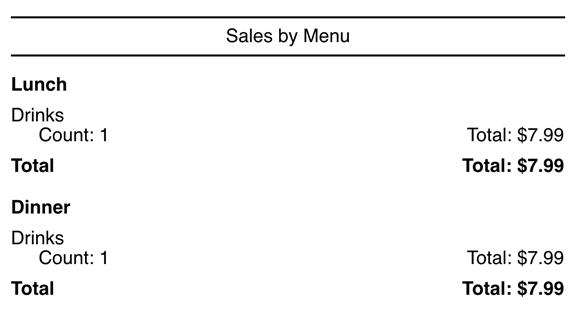
Running a Sales by Menu report we can see how TouchBistro recognizes which Menu and Menu Category the item was ordered under.
Chapter 12. Sample CSV Report Download
Click here to download a sample CSV report for the following Menu Reports:
Menu Item List Report
Sales Item Totals
Cost of Goods Sold Report
Menu Item Cost Report
Modifier Report
Sales by Menu
Ingredient Consumption Report
See Also


 Email
Support
 Frequently
Asked Questions