
 Email
Support
Email
Support Frequently
Asked Questions
Frequently
Asked Questions
Generating Sales Reports
Table Of Contents
Chapter 2. Ensure Your iPad Email Account is Set Up
Chapter 5. Generating a Sales Totals report
Section 1. How is the Sales Totals Report Generated?
5) Understanding Tax Rounding in TouchBistro
6) Rounding Differences Due to Splitting Shared Items
Chapter 6. Adding Additional Reports
Section 1. How is the Daily Sales Report Generated?
Section 2. How is a Sales by Section Report Generated?
Section 1. How is the Sales by Table Report Generated?
Section 2. How is a Sales by Category Generated?
Chapter 11. Detailed Takeout Report
Section 1. How is the Detailed Takeout Report Generated?
Chapter 12. Takeout Type Report
Section 2. How is the Takeout Type Report Generated?
Chapter 13. Detailed Discount Report
Section 1. How is a Detailed Discount Report Generated?
Section 1. How is a Void Report Generated?
Chapter 16. Waiter Sales Item Totals
Section 2. How is a Waiter Sales Item Totals Report Generated?
Chapter 1. Introduction
TouchBistro’s Sales Reports section allows you to generate reports about your sales totals (based on sales category), returns, refunds, and auto grats collected.
Chapter 2. Ensure Your iPad Email Account is Set Up
Many reports can only be viewed by emailing them to yourself as a CSV file. Before you start to generate reports, you should ensure you have an email account set up on your iPad(s). To set up an email account see this guide on the Apple site.
Chapter 3. Sales Figures
Sales data is reported before taxes unless you’re using inclusive taxes and you’ve set TouchBistro to report sales data to include the tax. If you are using Inclusive Tax, see this discussion about how that affects reporting. Tips added to credit cards are not reported in sales totals.
Chapter 4. Accessing Reports
To access a report, log in either as a manager profile or the admin profile. Best practices are not to use the admin login unless you need to access the admin function to make permanent changes to your restaurant.
In this guide, we’ll assume you’re using a manager profile (or a profile that has Can Access Reports enabled).
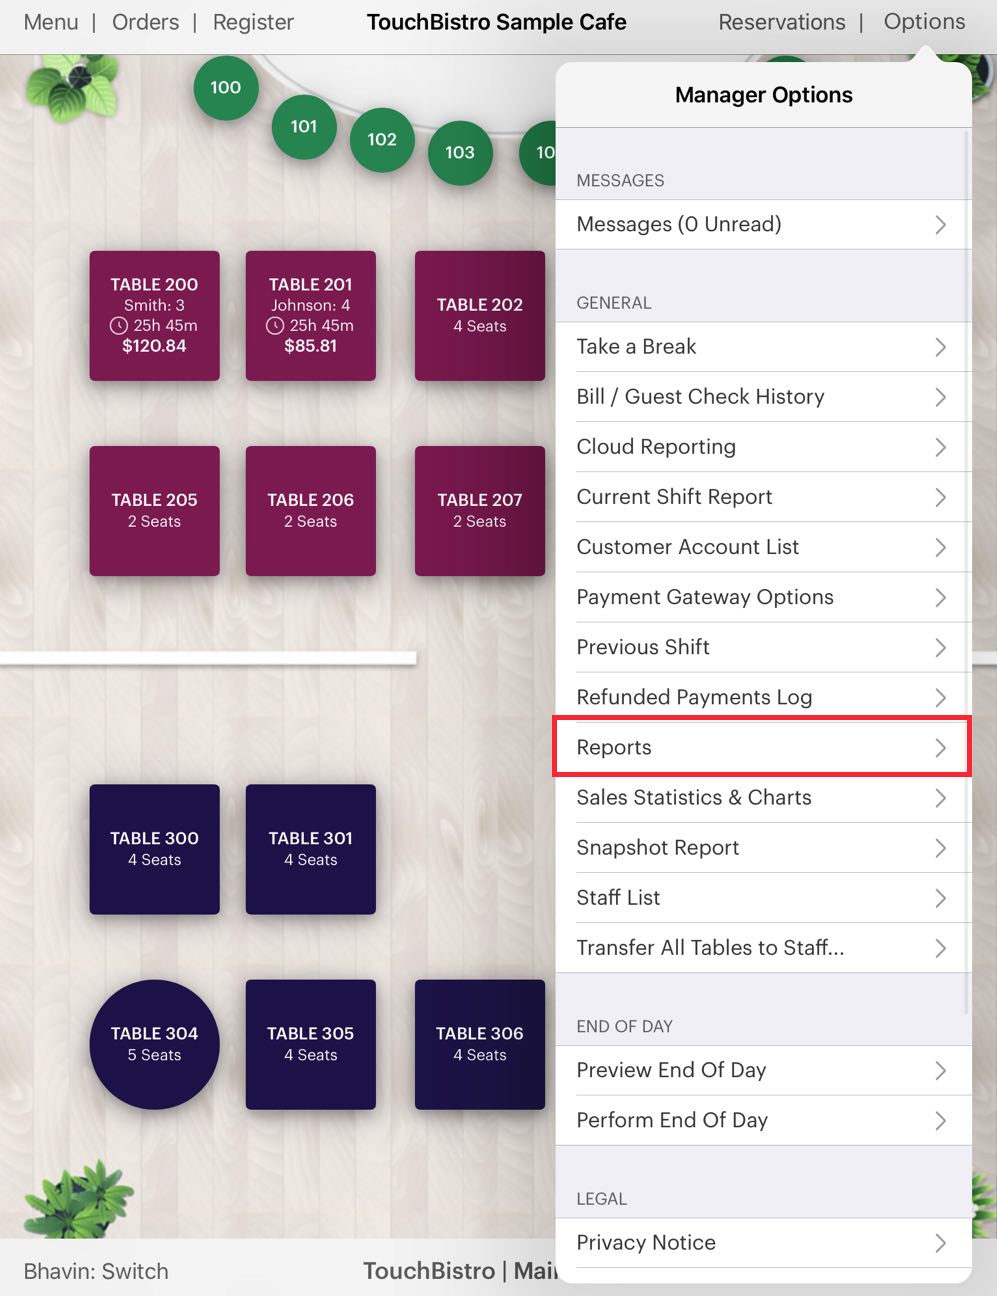
1. From your floor plan screen tap Options.
2. Tap Reports.

3. The Previous Business Days screen lets you quickly access individual business days (that is the block of time when you opened your venue via TouchBistro and when you closed it). Hence, a Business Day will not be 24 hours. If you opened your venue at TouchBistro at 9 am Tuesday and did your end of day and closed it Wednesday 3 am, TouchBistro will record that as a business day. In this example, we’re interested in a date range. We’ll generate a Sales Total report for the month of June. Tap Cancel to set a date range.

4. Use the date wheels at the top to set the start and end of the range. In this example, we’re setting the range from the very start of June 1 to the end of June 30. So, the whole month of June. TouchBistro treats 12:00 AM as the start of the day and 11:59 PM as the end of the day.
5. Tap Sales to access reports associated with your sales, voids/discounts, and waiter performance.
Chapter 5. Generating a Sales Totals report
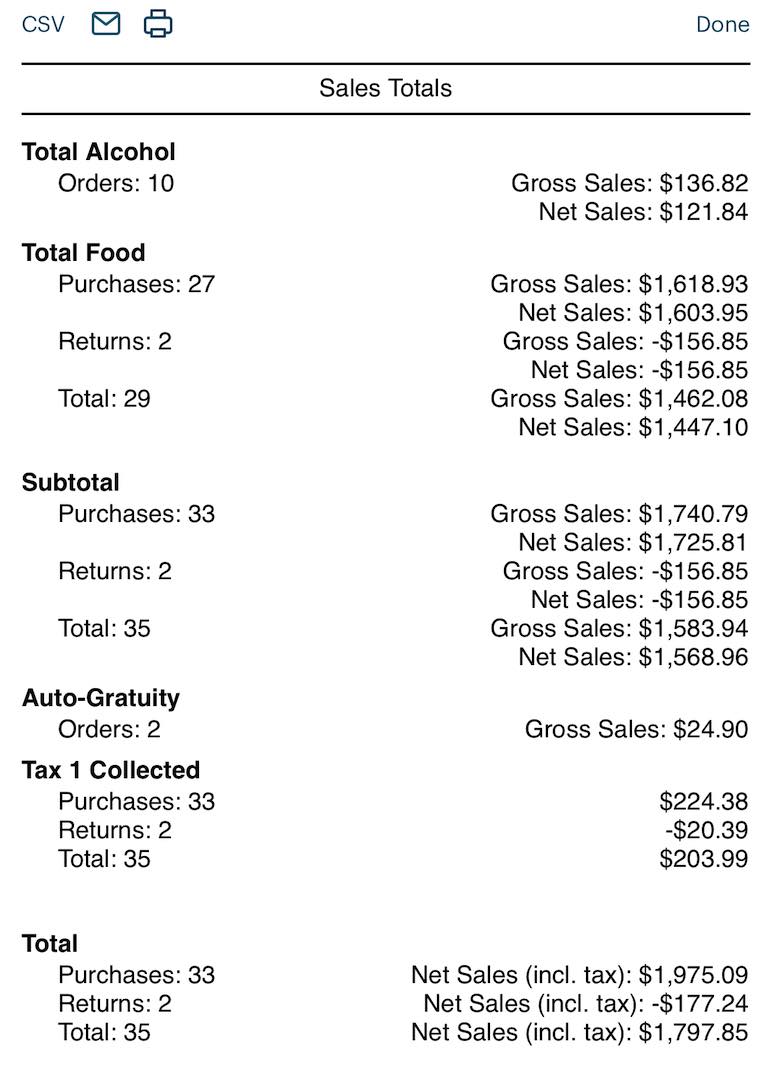
The Sales Totals report will give you a breakdown of purchases and returns. If you account for auto grats separately from tips, it will give you a breakdown of money collected from auto grats. The Sales Totals report gives you both gross sales (sales before discounts) and net sales (sales after discounts). As well, you will get sales totals before taxes and with taxes.
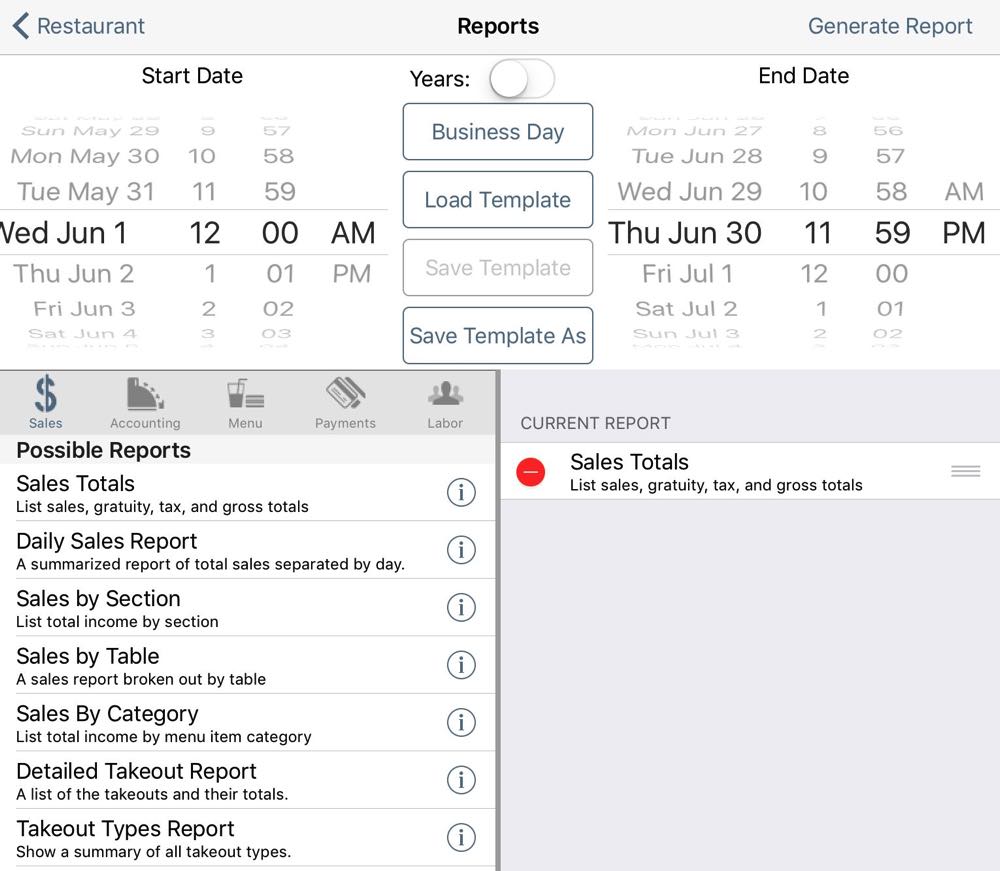
1. Add the Sales Totals report to the Current Report column by tapping it.
2. You can add in additional reports by tapping them. For example, tap Sales by Section.
3. You can remove a report at any time by tapping the Delete ![]() icon next to the appropriate report and then tapping Delete.
icon next to the appropriate report and then tapping Delete.
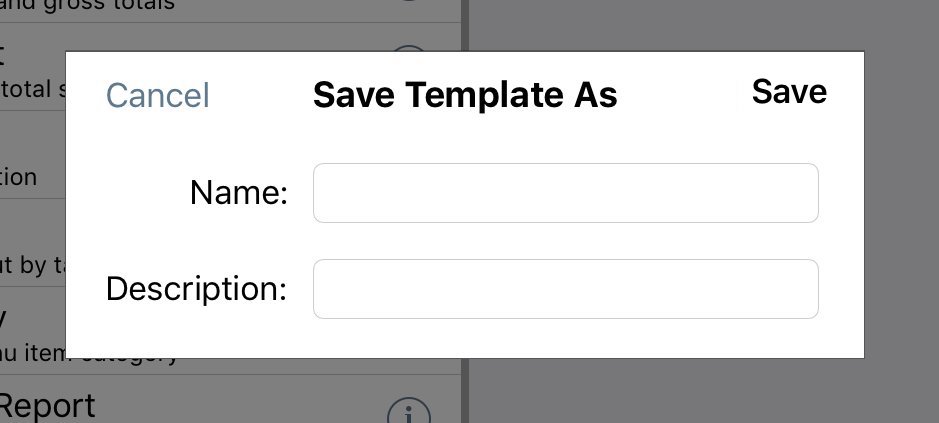
4. If you’ve created a report with multiple reports and you’ll need to re-generate the report at a later date, tap Save Template As. Use Load Template to access this saved report.
5. In this example, we’ll only generate a Sales Totals report.
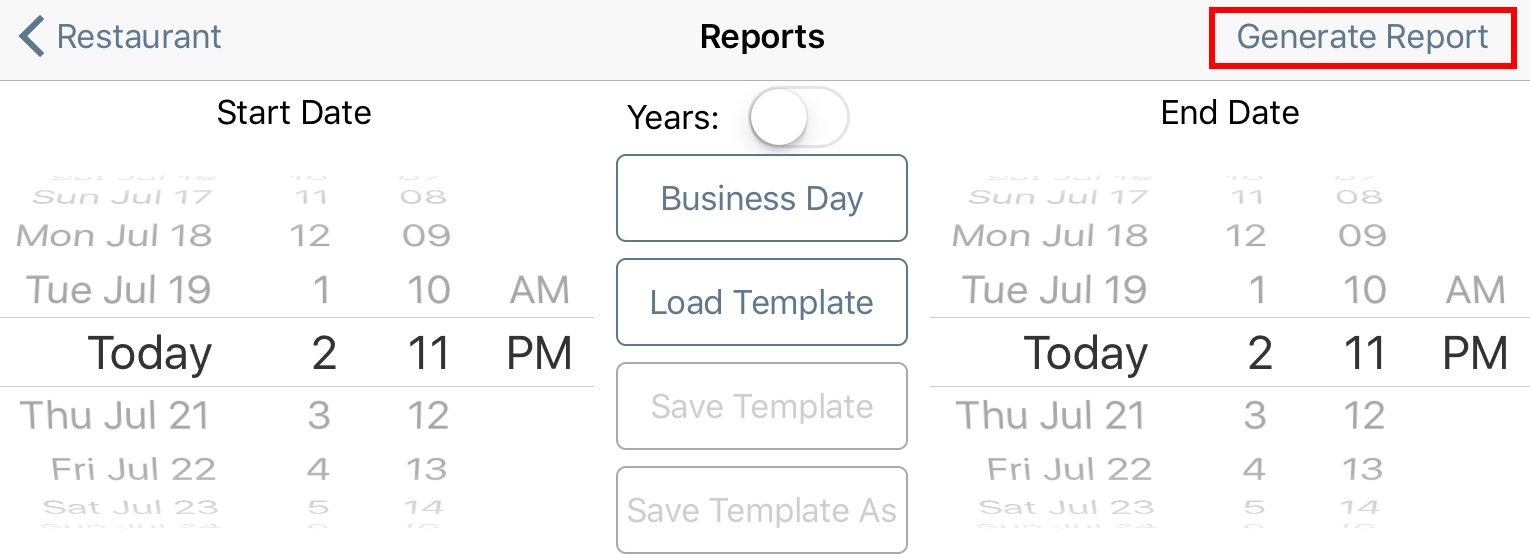
6. Tap Generate Report on the top right when you’re ready to view the report results.
7. When you generate a report, TouchBistro gives you the following options at the top of the report:
|
Option
|
Description
|
|
|
Tap CSV to email the report as a CSV (comma separated values) file. A CSV file can be opened in a spreadsheet.
|
|
|
Tap Email to email the report as a formatted email.
|
|
|
Tap Printer to print the report to a configured printer.
|
8. If you choose to email your report, ensure you’ve setup an email account under your iPad’s Settings. TouchBistro uses your iPad’s existing email credentials for emailing.
Section 1. How is the Sales Totals Report Generated?
1) Sales Categories
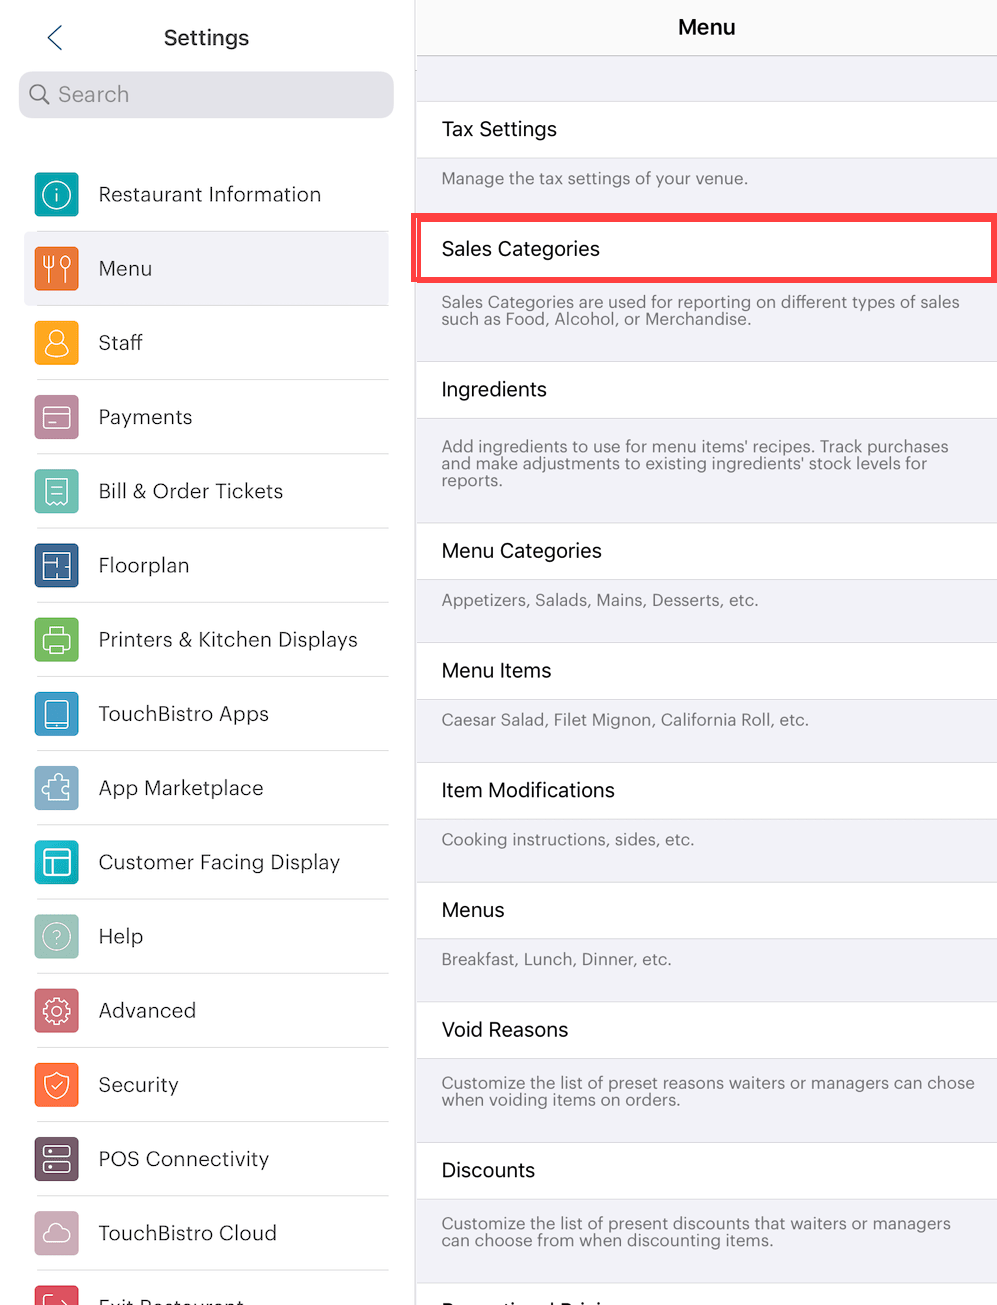
The Sales Totals report reports sales by sales categories. Sales categories are set up on the Admin screen. Tap Menu | Sales Categories. Sales Categories are applied to Menu Categories and can be applied on an individual basis to Menu Items.
2) Returns
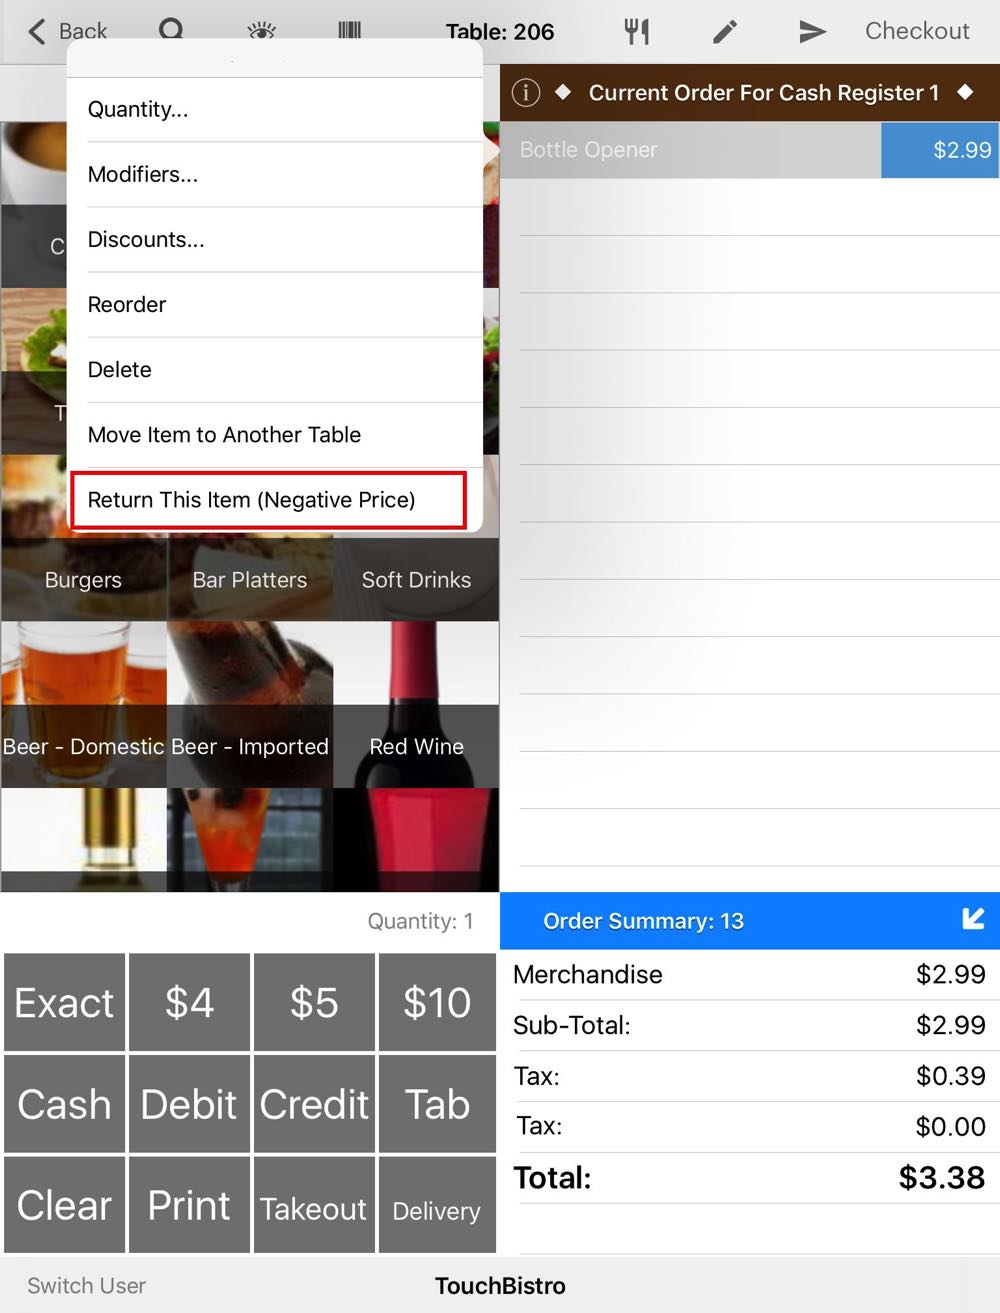
A return total indicates product has been returned. On an item you’ve flagged as Allow Returns, you can tap the item and then tap Return This Item (Negative Price) to process a cash or credit card return. You have to explicitly flag menu items as being returnable in Admin | Admin Settings | Menu | Menu Items.
Note: the Sales Totals report will be replace Orders with Purchases if any items were returned.
3) Auto Grats
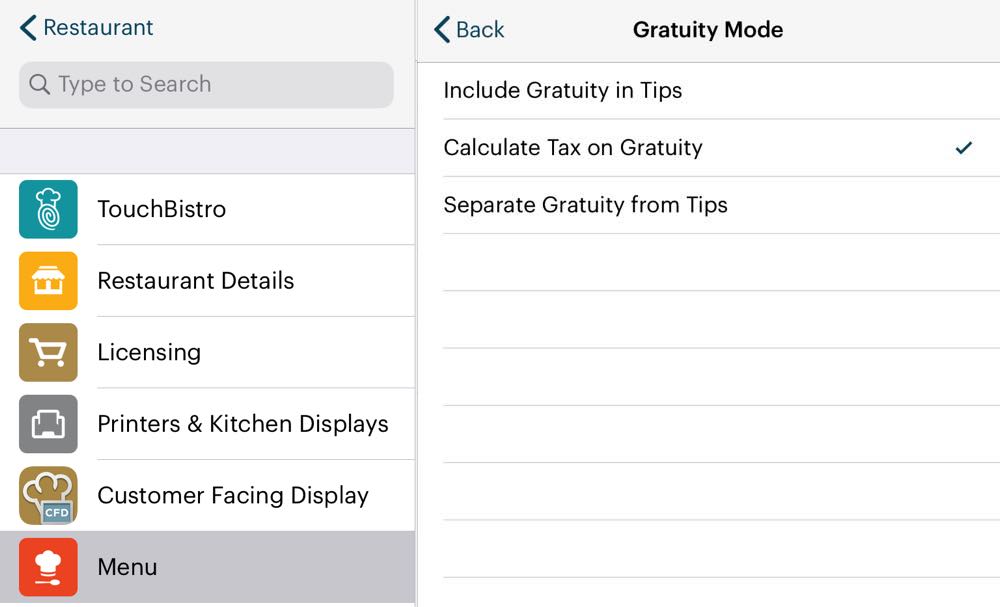
The Sales Total report reports gratuity or auto grats. If you’ve setup TouchBistro to treat auto grats (gratuity) differently from tips (because your tax jurisdiction requires it), then TouchBistro will report the auto grats here. Auto grats are setup under Admin | Admin Settings | Menu | Gratuity.
4) Taxes
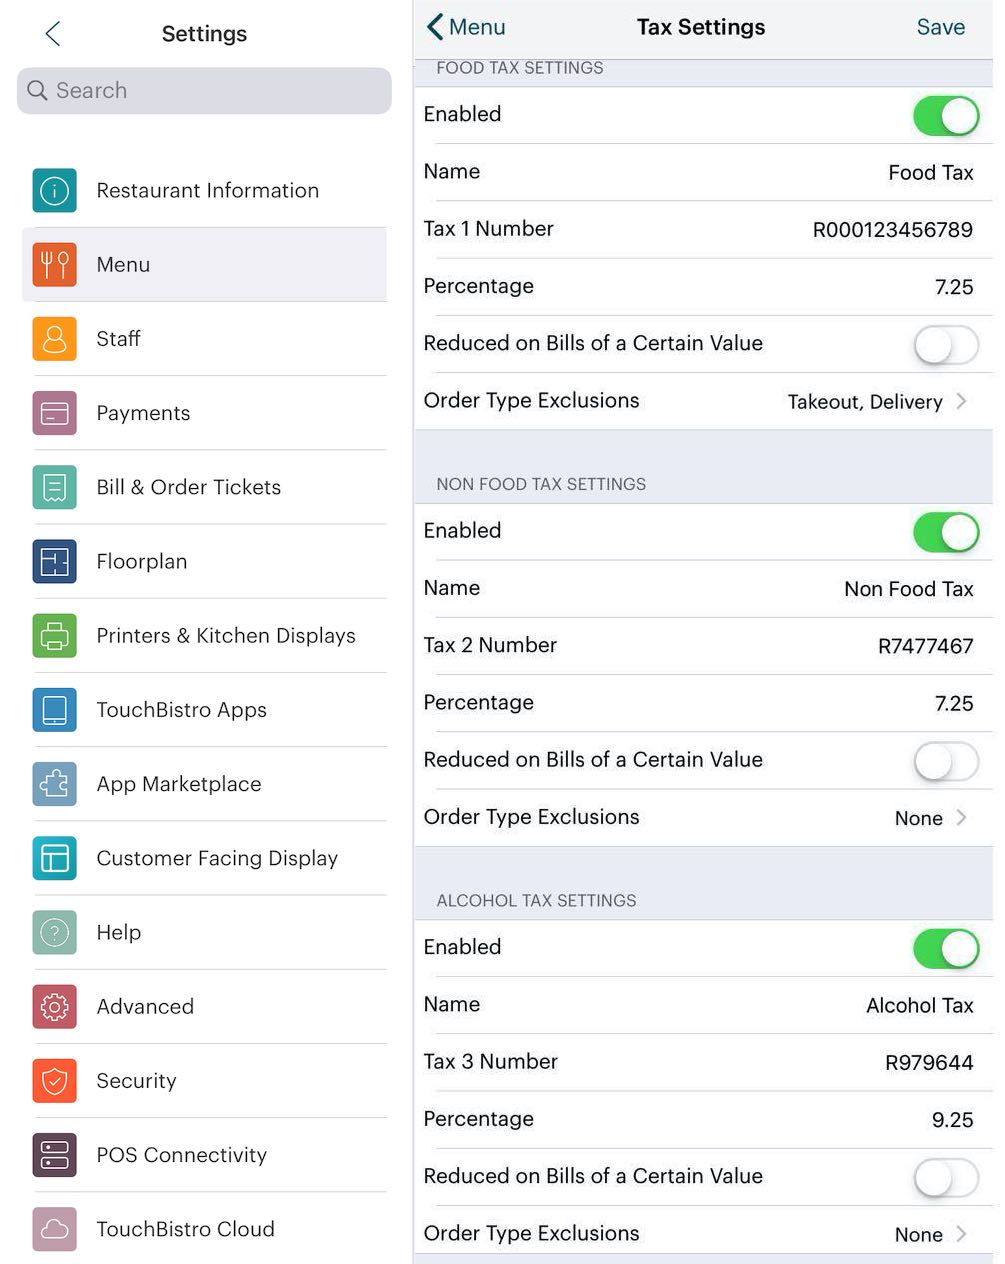
The Sales Total report reports taxes collected. Tax rates are set under the Menu page. Tap Tax Settings.

Taxes collected for menu items are set in the Menu Category page.
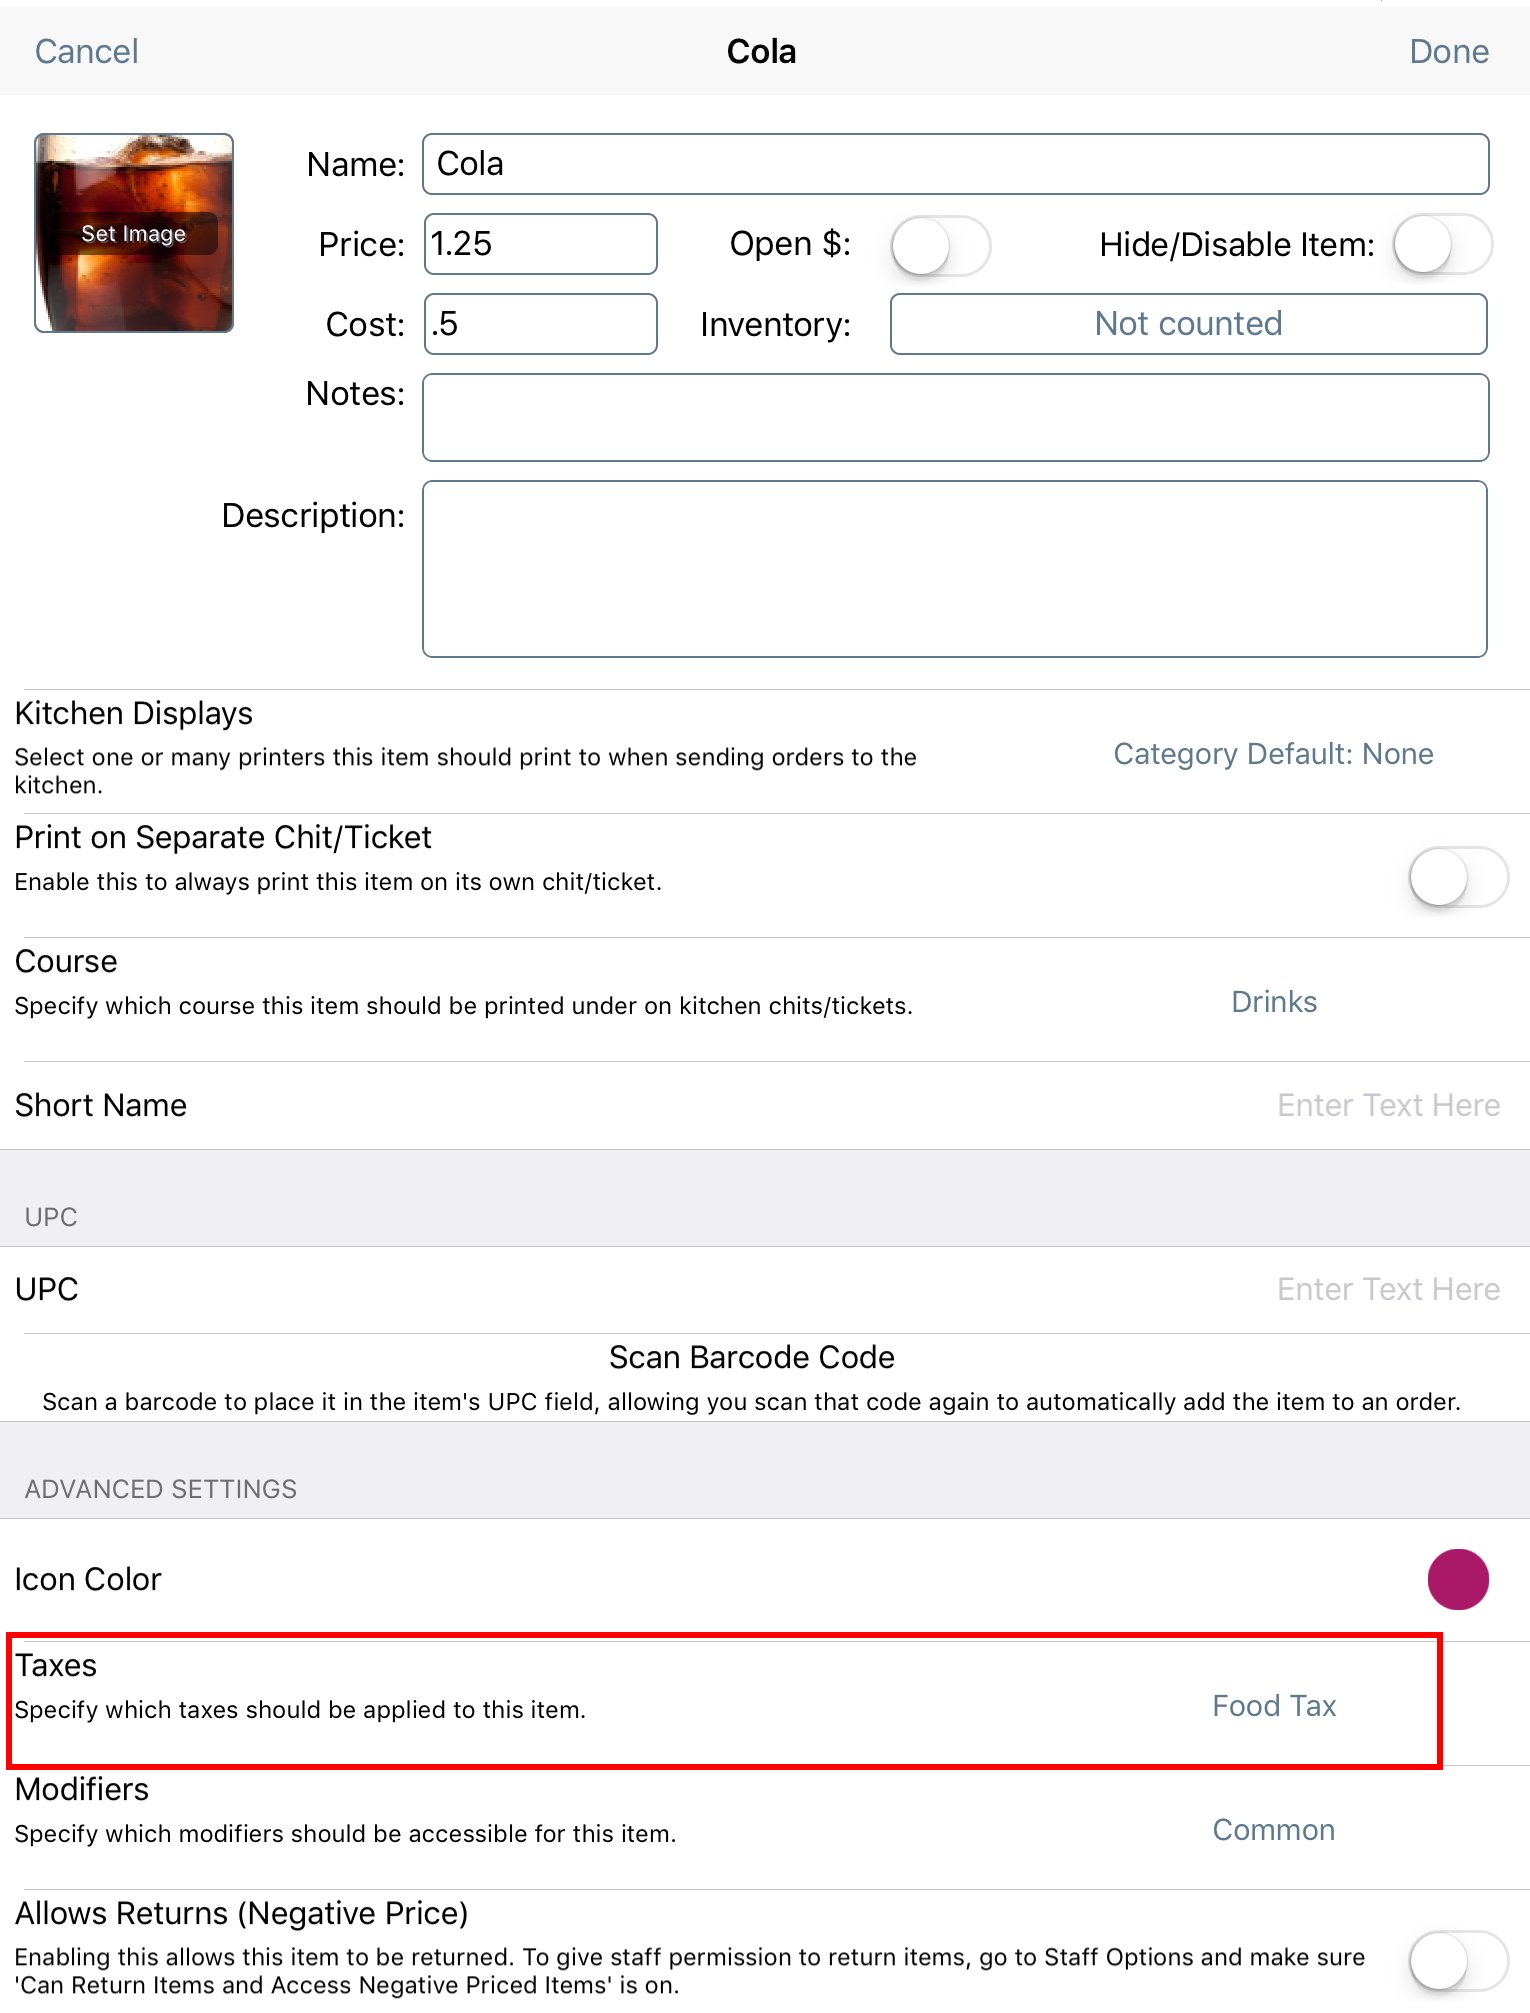
Tax can also be specified per menu item.
5) Understanding Tax Rounding in TouchBistro
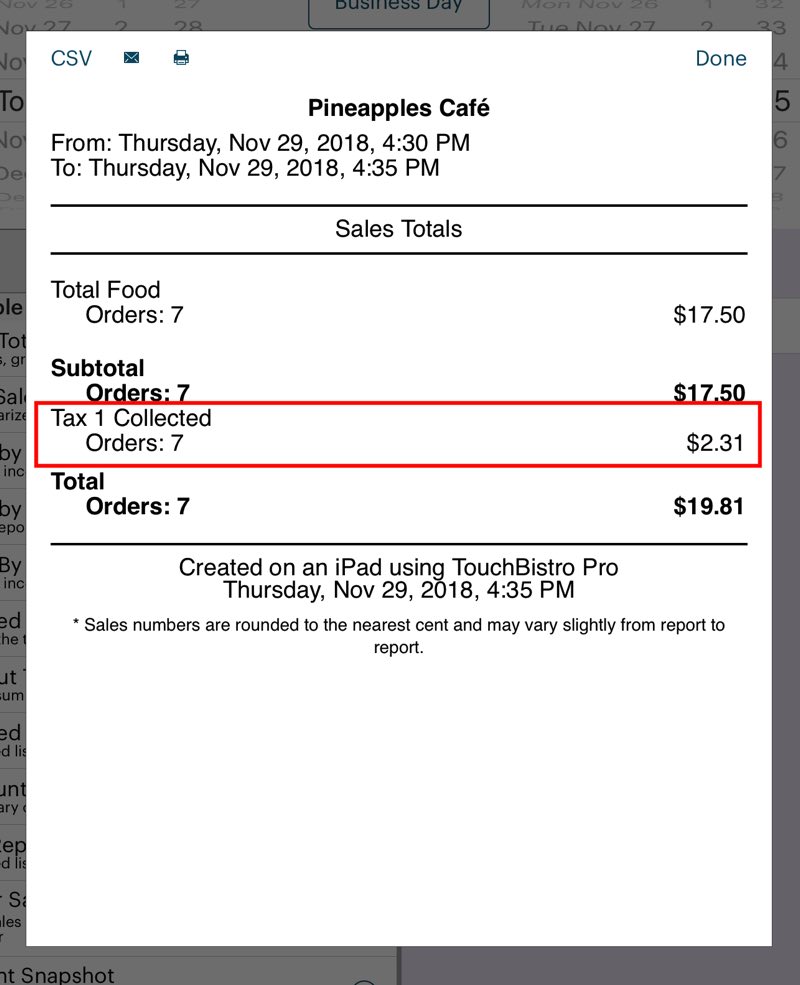
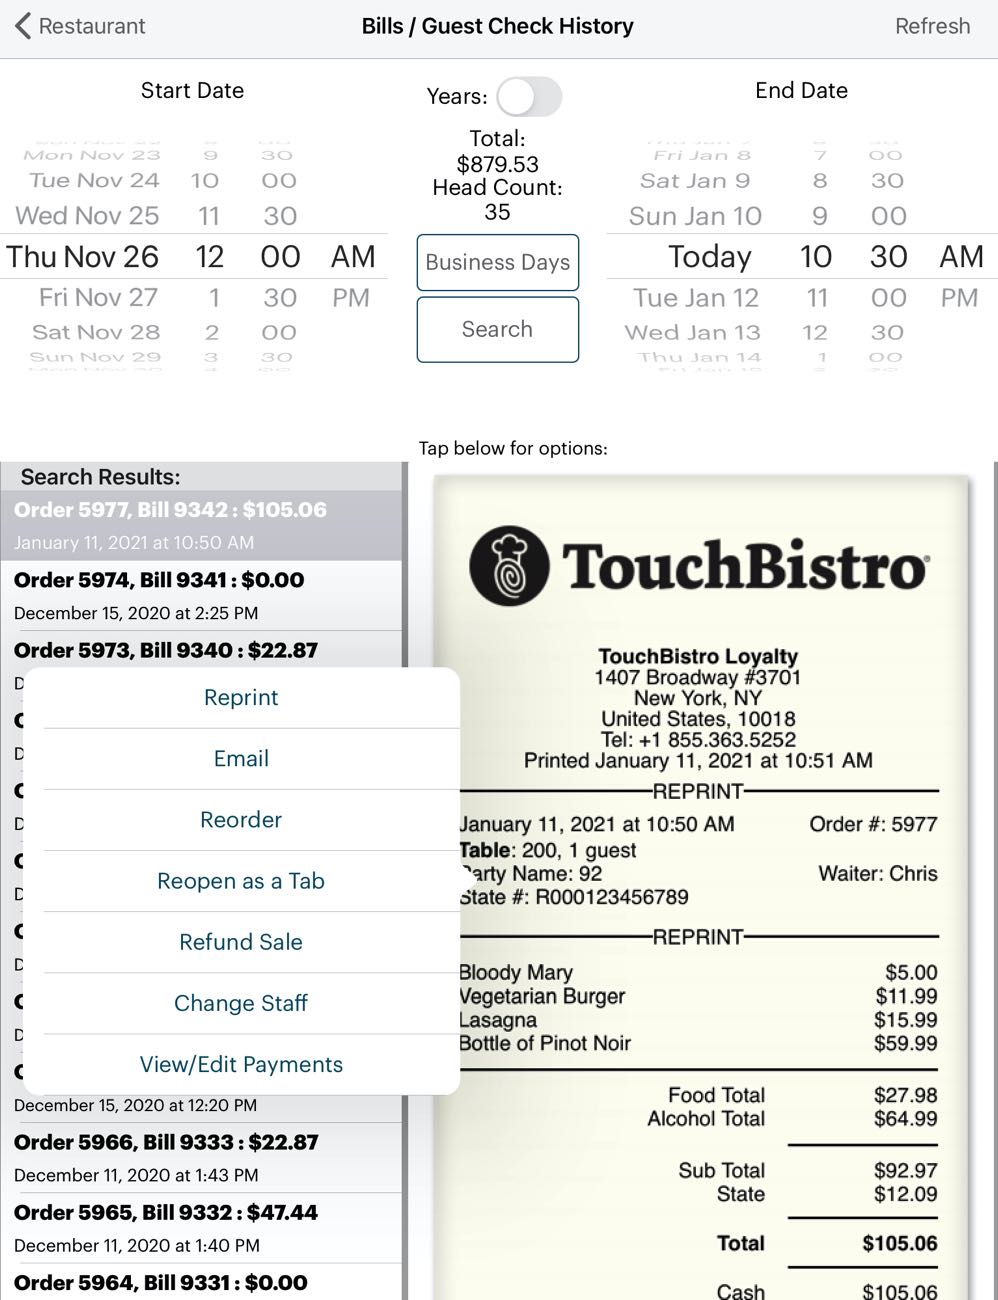
There may be times when you look at your Sales Tax Collected figure and it seems to be off. In the above Sales Totals report we can see we collected $2.31 in sales tax on 7 orders that totaled $17.50. If you were collecting 13% in sales tax, you might be tempted to double check that figure. So $17.50 x .13 = $2.275. Rounding up that’s $2.28. But, wait, TouchBistro is reporting we collected $2.31 in sales tax, or 3 cents more (technically 3.25 cents more). Is something funny going on?
No. You’ll notice when you double checked by calculating 13% on the total you had to round up by half a cent. TouchBistro is doing the same thing when it calculates taxes owed on each item on the guest check. On most guest checks, a tax rounding will happen on at least one of the items added to the guest check. Over the long run half cent rounding ups (1.5 cents in tax gets rounded up to 2 cents in tax) should equal half cent rounding downs (1.4 cents in tax gets rounded down to 1 cent in tax). However, if you have an inordinate number of items and guest checks that result in, say, half cent rounding ups, your Sales Tax Collected figure may seem skewed.

We can see from the Bills / Guest Check History pictured above that Sales Total and the Sales Tax Collected figure are calculated based on seven individual guest checks. Each represents the purchase of a single croissant at $2.50. If we examine each bill, each bill has calculated 33 cents in sales tax. However, $2.50 x .13 = $0.325. So each bill represents a rounding up of half a cent. The attempt to double check by multiplying the sales total by the tax rate only has to work in a single half cent round up. So your double checking of TouchBistro’s “math” misses 3.25 cents collected over 7 bills due to the rounding up. The table below should illustrate
|
Sale
|
Exact Tax Calculated (13%)
|
Charged Tax (Rounded to 2 Decimals)
|
|
|
Bill 1
|
$2.50
|
$0.325
|
$0.33
|
|
Bill 2
|
$2.50
|
$0.325
|
$0.33
|
|
Bill 3
|
$2.50
|
$0.325
|
$0.33
|
|
Bill 4
|
$2.50
|
$0.325
|
$0.33
|
|
Bill 5
|
$2.50
|
$0.325
|
$0.33
|
|
Bill6
|
$2.50
|
$0.325
|
$0.33
|
|
Bill 7
|
$2.50
|
$0.325
|
$0.33
|
|
TOTAL
|
$17.50
|
$2.275
|
$2.31
|
The take-home here is not to panic. Most governments want you to remit the total of the taxes calculated and collected on each and every bill (so all those .33 cents customers actually paid you).
6) Rounding Differences Due to Splitting Shared Items
TouchBistro lets you add shared items.
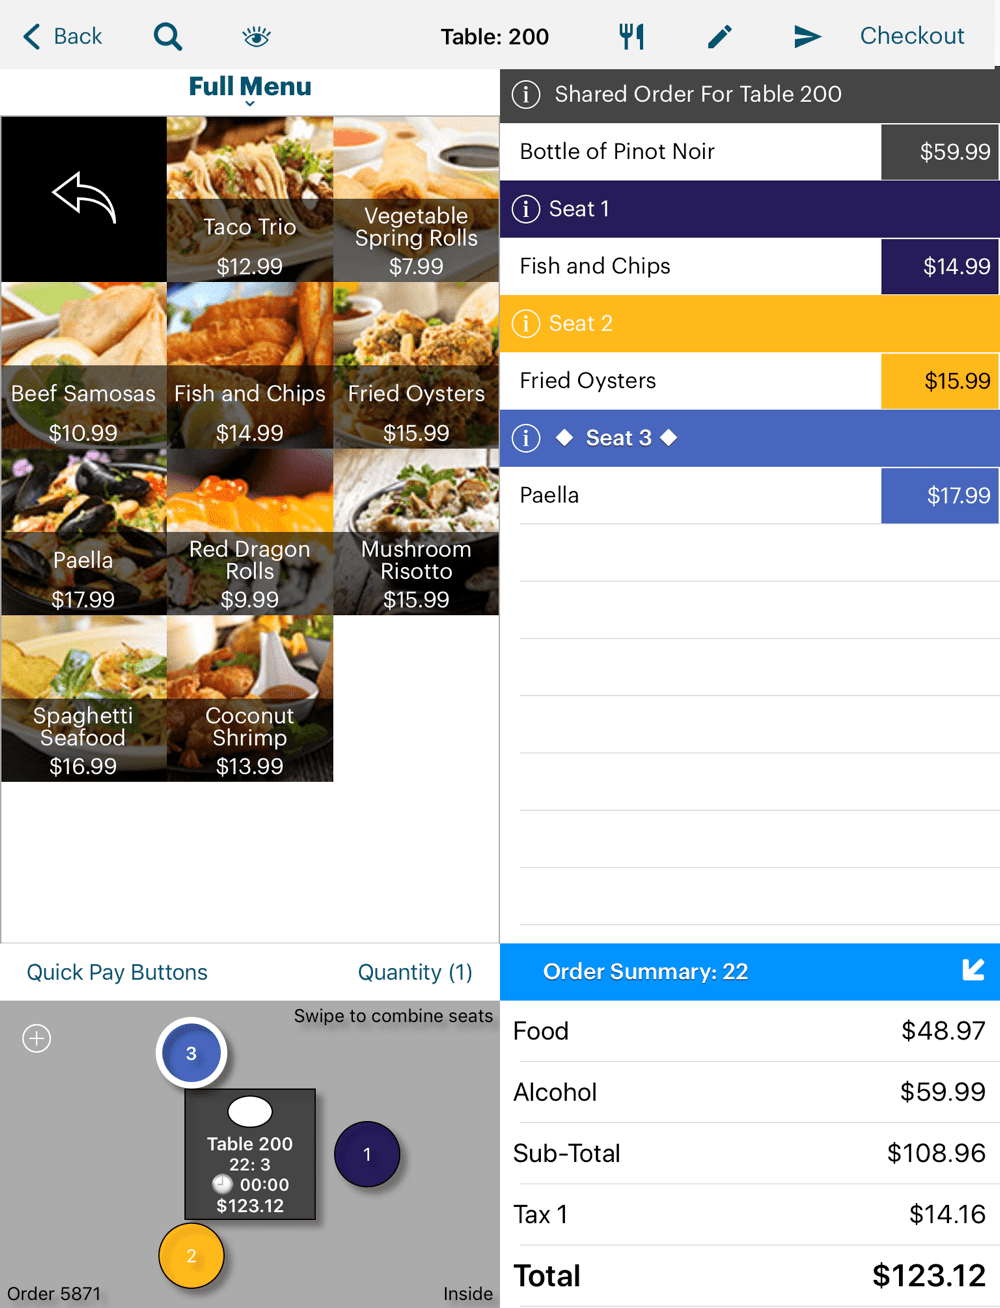
In the example above, we can see a table of three is sharing a $59.99 bottle of wine.
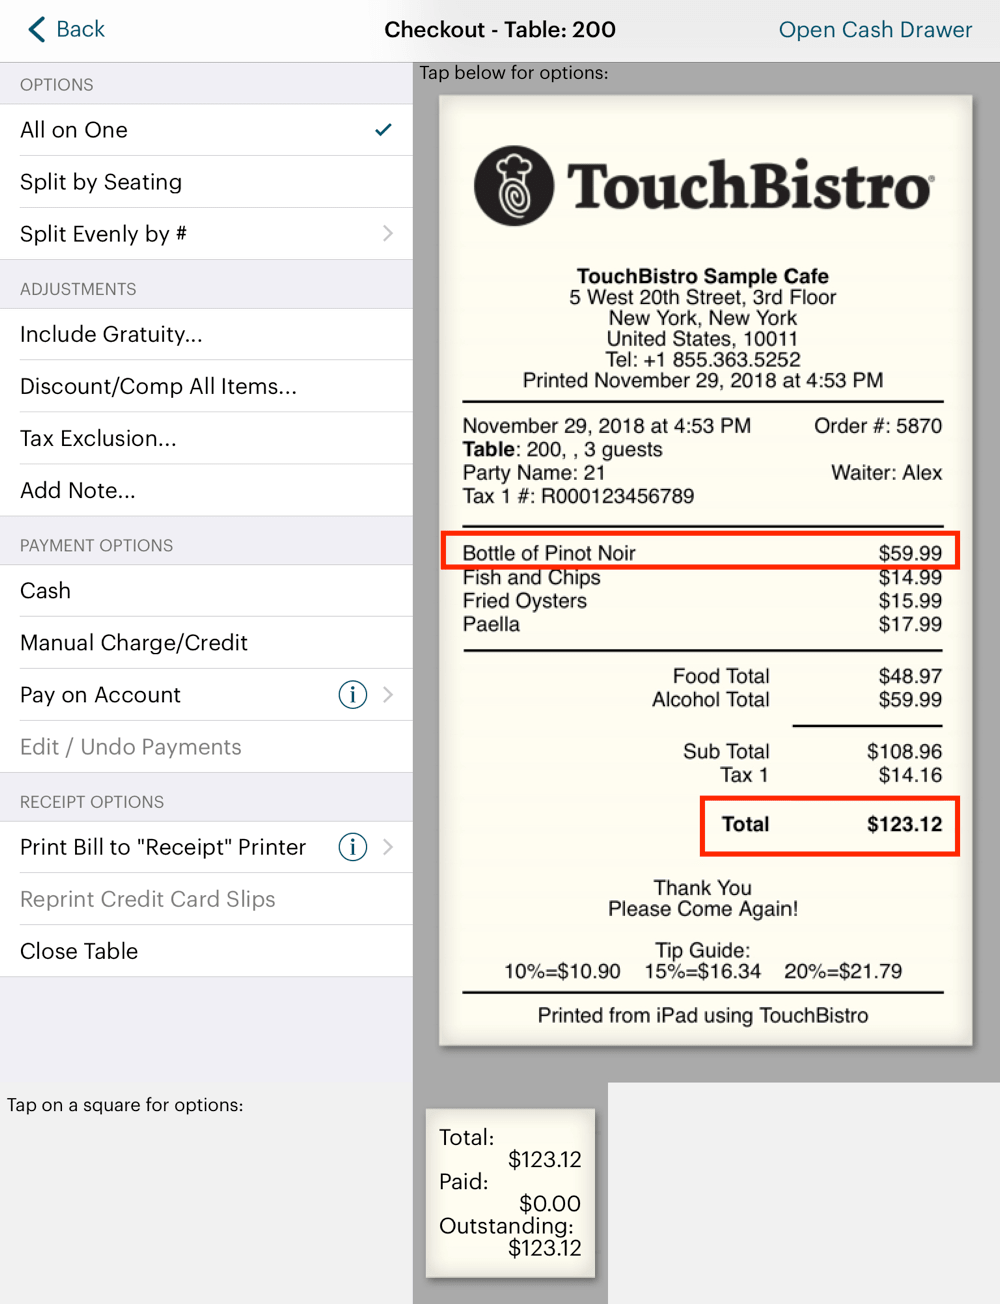
The table wants to pay. If they paid one bill the total would be $123.12. The bottle of wine, of course, gets billed as $59.99.

If this was the only customer for the day and we did an end of day, we would see our before tax Alcohol and Food totals equal our Subtotal ($108.96).
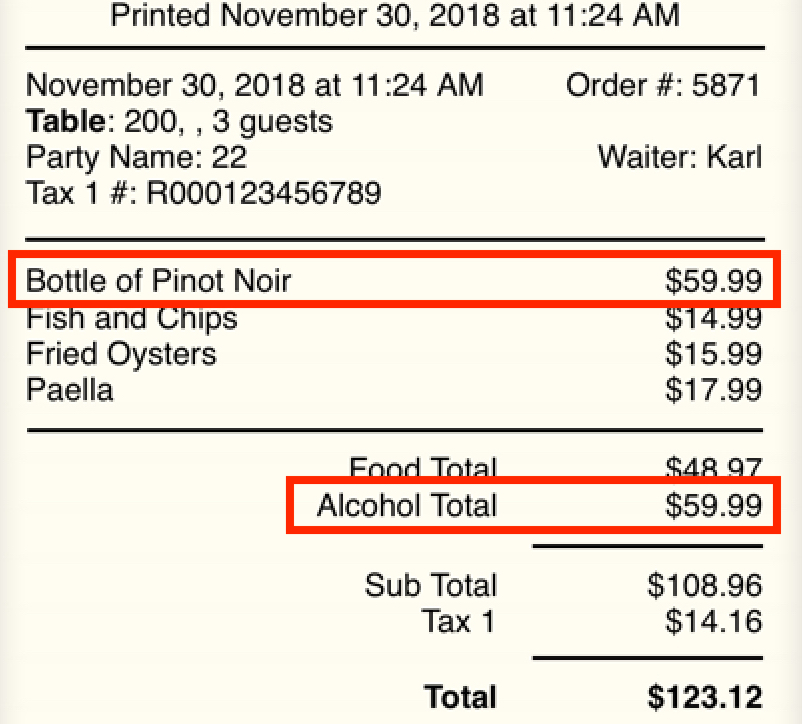
The $59.99 Alcohol Total equals the $59.99 menu price of the single bottle of wine the table shared.
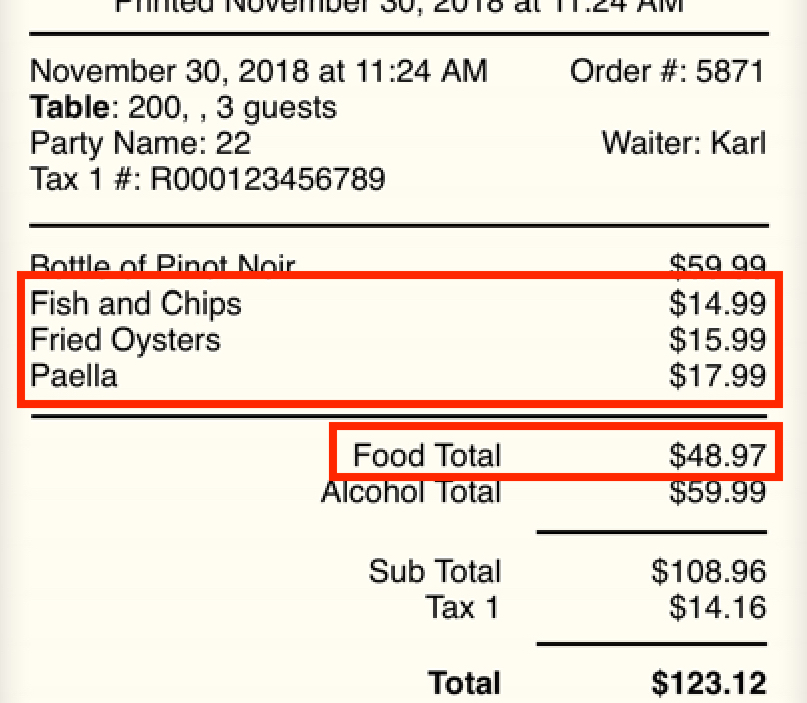
The $48.97 Food Total represents the total of the three food items order (Fish and Chips $14.99, Fried Oysters $15.99, Paella $17.99).
It’s important, however, to understand the Subtotal (as well as the Total figure at the bottom) are not calculated based a simple column addition, that is Total Alcohol + Total Food. The Subtotal figure represents the pre-tax money we collect from payments (cash, credit, etc.) at checkout time.

That is, Subtotal is a total of the Sub Total figure on all closed bills. Likewise Total is a total of a Total figure on all closed bills.
If you never split bills by seat (or used the Split Evenly by # option), Sub Total would always appear to be a simple column addition of Total Alcohol + Total Food. However, when you split shared items across seats, TouchBistro may have to round up or down the price split.
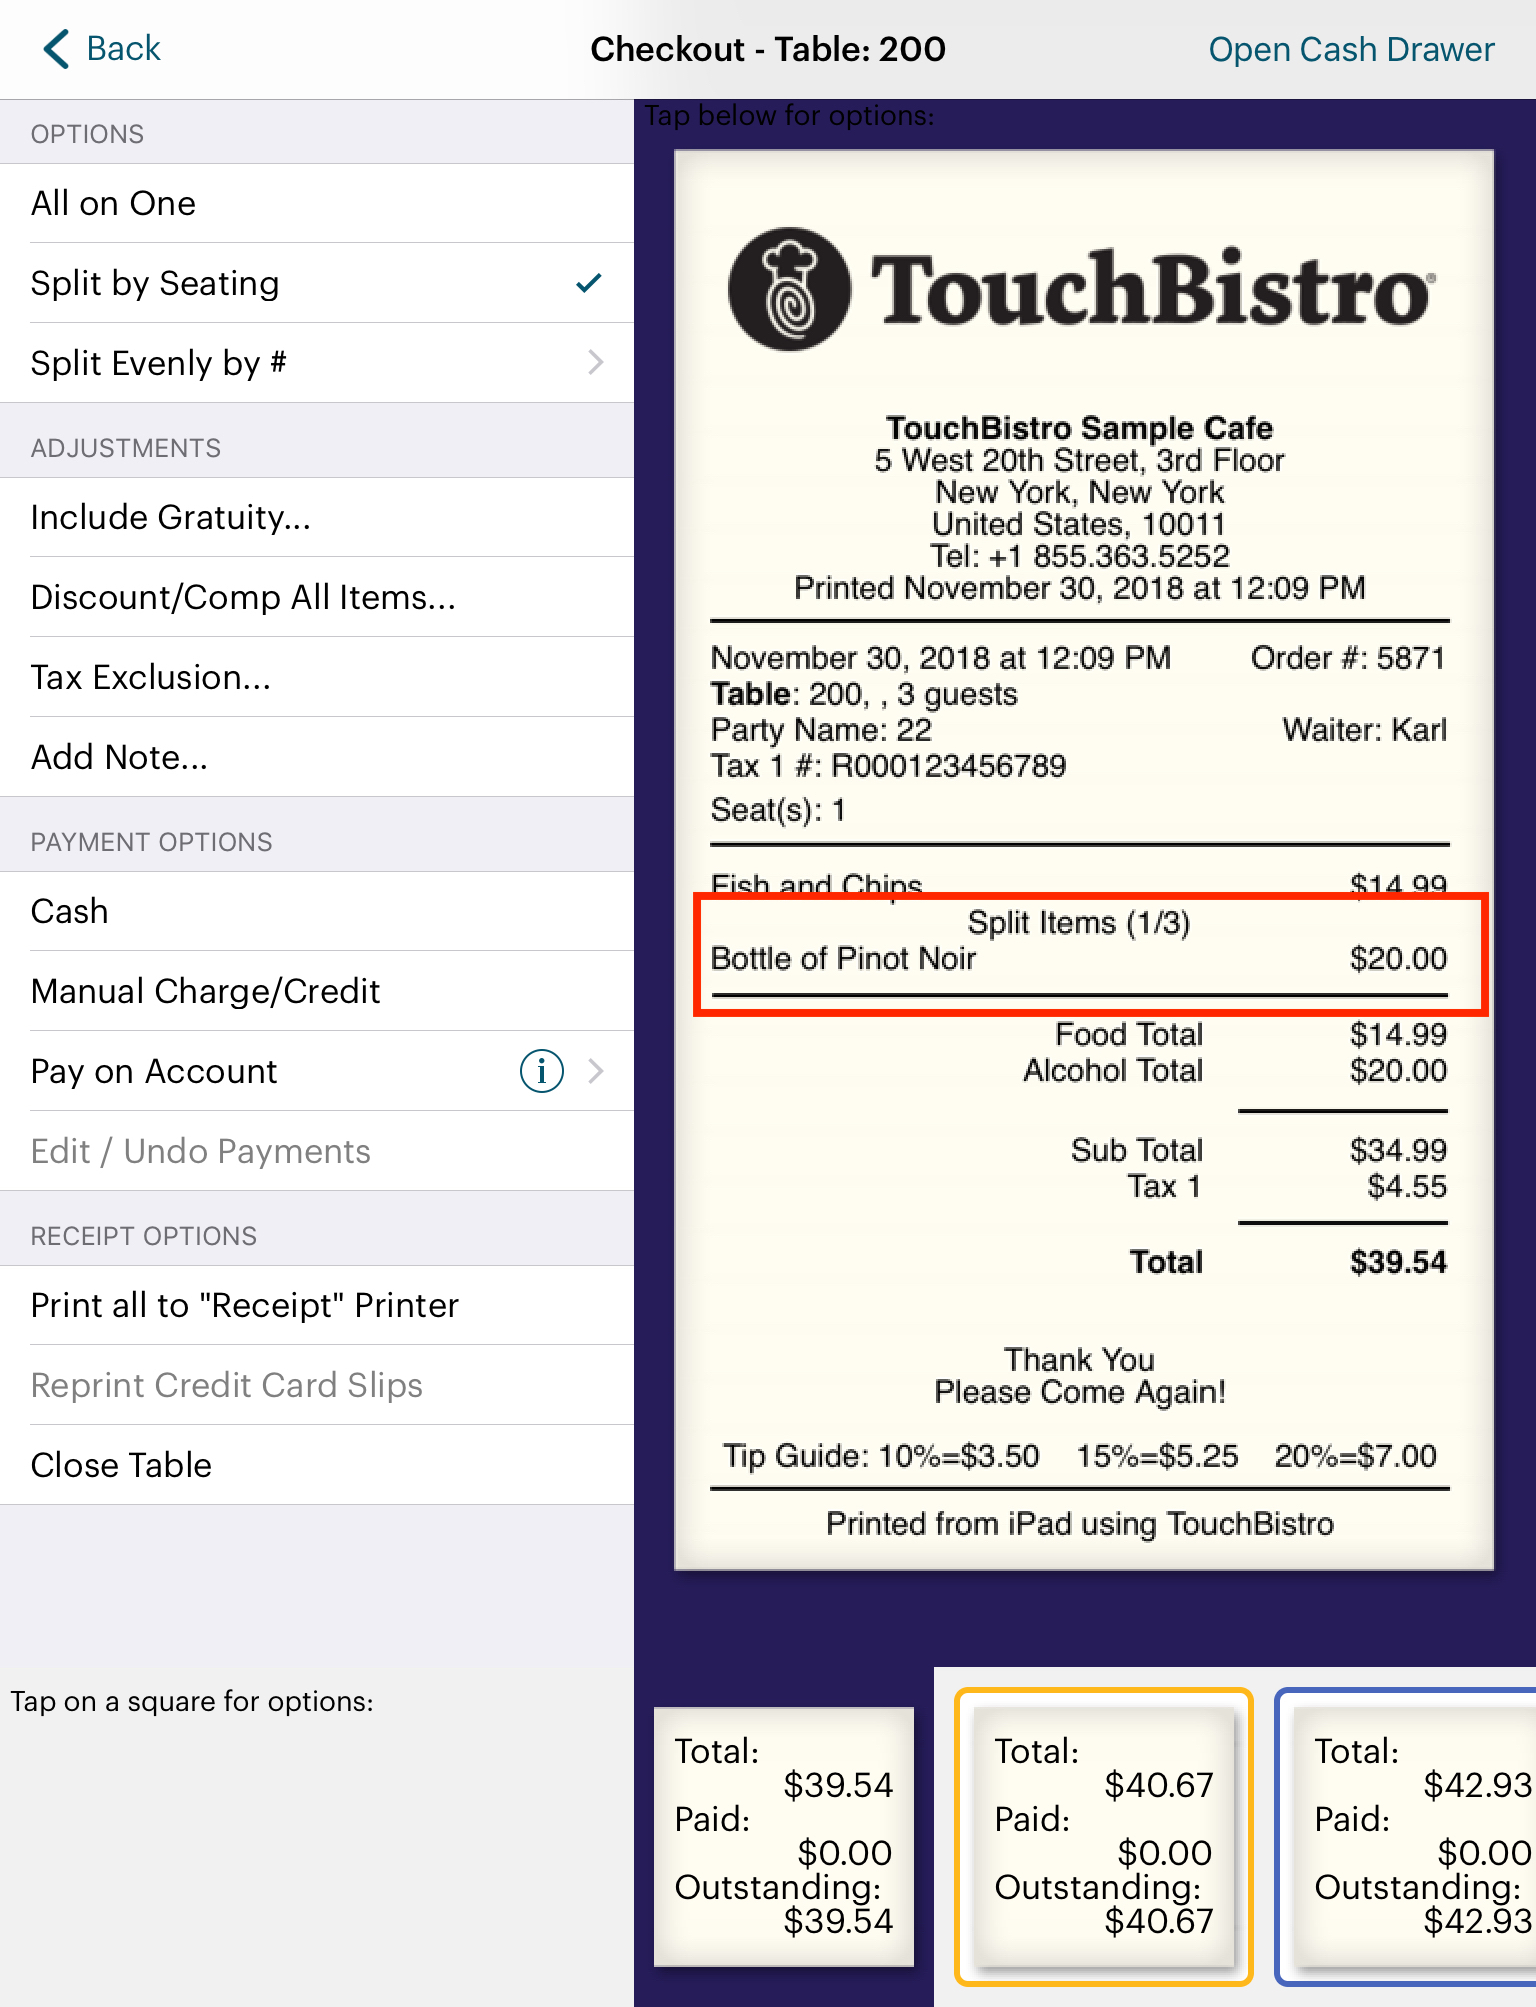
For example, our table wants to split the bill by seats. Each seat, of course, pays the full cost of their food orders. However, an exact three way split of the $59.99 bottle of wine is $19.9966666666667. Naturally, we do not bill each seat $19.9966666666667. TouchBistro uses conventional rounding rules and bills each seat $20.
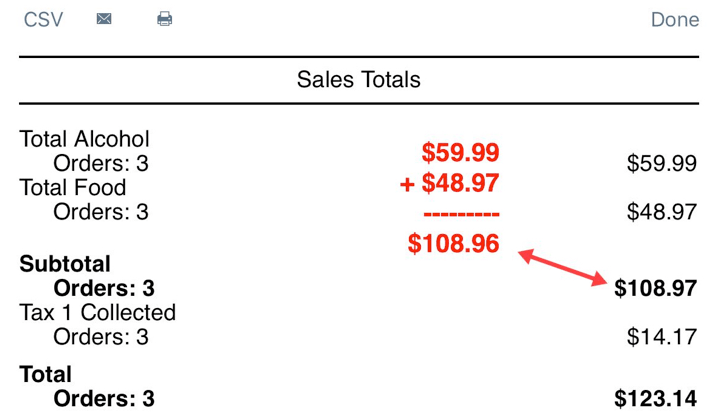
If this is the only customer and we do our end of day, we would see this. If we totalled the Total Alcohol and Total Food figures, it would not agree with the Subtotal figure. There’s a penny difference.
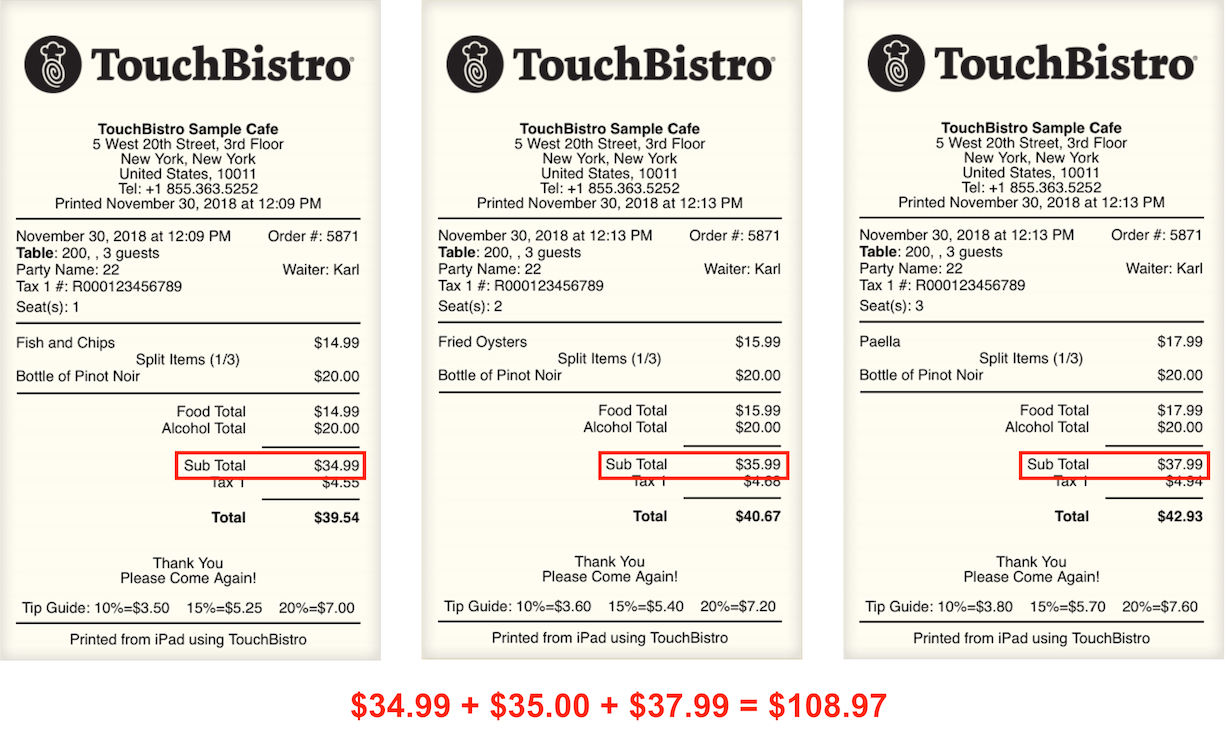
But, remember, the end of day Subtotal figure represents a total of all Sub Total figures from all closed bills. Our split resulted in three bills and three Sub Total figures. As the illustration indicates, totalling those Sub Total figures we can see we collected $108.97 before tax. Hence that figure is properly reflected on the end of day’s Subtotal.
7) Bankers’ Rounding
TouchBistro does not do bankers’ rounding. Under bankers’ rounding, if the third decimal place would normally round the second decimal to an odd number (1, 3, 5, 7, 9), the second decimal is NOT rounded. If the third decimal place would normally round the second decimal place to an even number (2, 5, 6, 8, 0), bankers’ rounding DOES round the second decimal place.
For example, under normal rounding rules, $13.228 would round to $13.23. However, bankers’ rounding would leave it as $13.23. $13.238, by contrast, would round to $13.24 using bankers’ rounding. TouchBistro would round $13.228 to $13.23 and $13.238 to $13.24.
Chapter 6. Adding Additional Reports
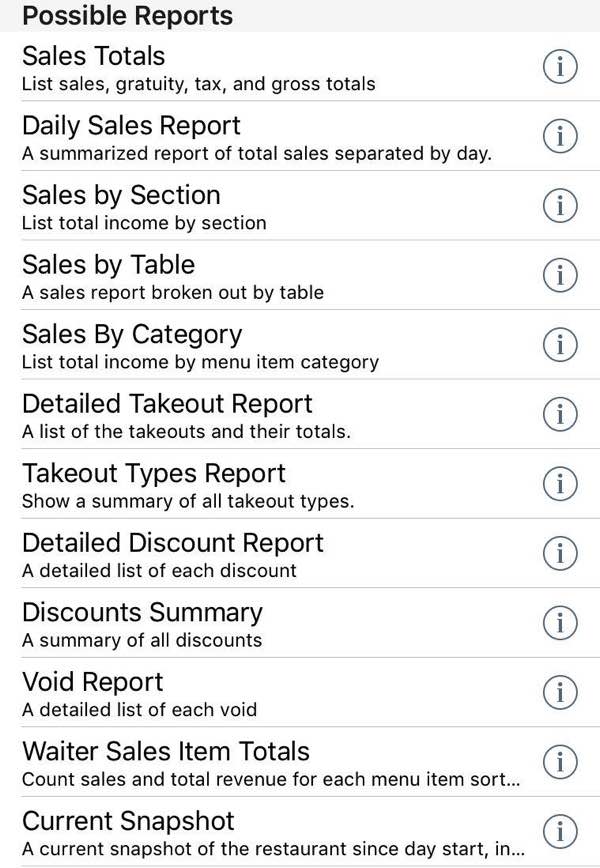
The Sales Reports section provides nine reports in total. In addition to the Sales Totals report, you can add a Daily Sales Report, Sales by Section, Sales by Table, Sales by Category, Detailed Takeout Report, Takeout Report, Detailed Discount Report, Discounts Summary, Void Report, Waiter Sales Item Totals, and Current Snapshot.
Chapter 7. Daily Sales Report
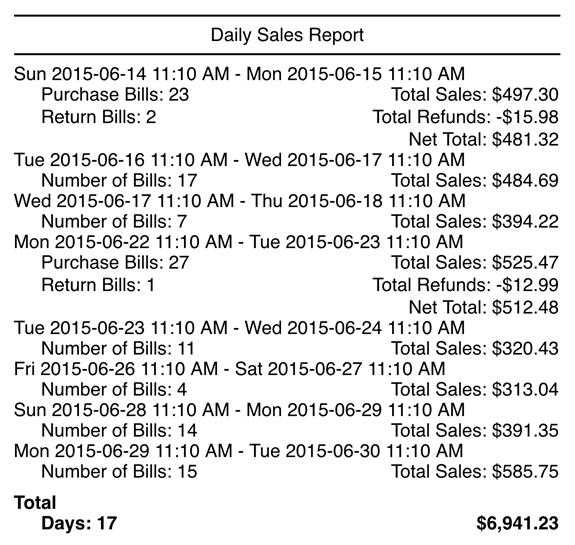
The Daily Sales Report gives a day by day (24 hour) break down of the total number of bills, the total numbers of returns, and the day’s sales total. This report ignores your “closed days”. That is, if you opened your venue at Monday 8 am and closed it at 11 pm, this report will give you Monday’s sales starting at Monday 12:00:01 AM and a full 24 hours onward (that is until Tuesday Midnight).
The final Total sales amount does not factor in refunds. For example, if you had $100 in sales for the 24 hour period and one $10 refund, your Total for all days will be $100 not $90.
Section 1. How is the Daily Sales Report Generated?
Number of bills (or Purchase Bills if there have been returns) is the number of closed bills for the given 24 hour period. Sales totals are totals of all closed bill totals for the given range.
1) Closed Bills
You can see individual bills under Admin | Bills | Guest Check History (or Options | Bills | Guest Check History for managers). Set a date range and tap Refresh.
Note: If you would like an hourly sales report (sales by each hour of a particular day), use the Sales Statistics & Chart report found under Admin | Sales Statistics & Chart.
Chapter 8. Sales by Section
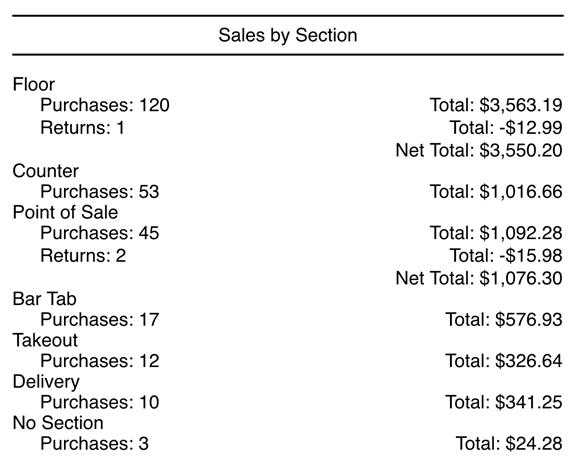
The Sales by Section gives you a breakdown of the number of closed bills (purchases), returns, and sales totals for your sections, floors, Point of Sale, and orders (take out, delivery, bar tabs).
Section 1. Sort by
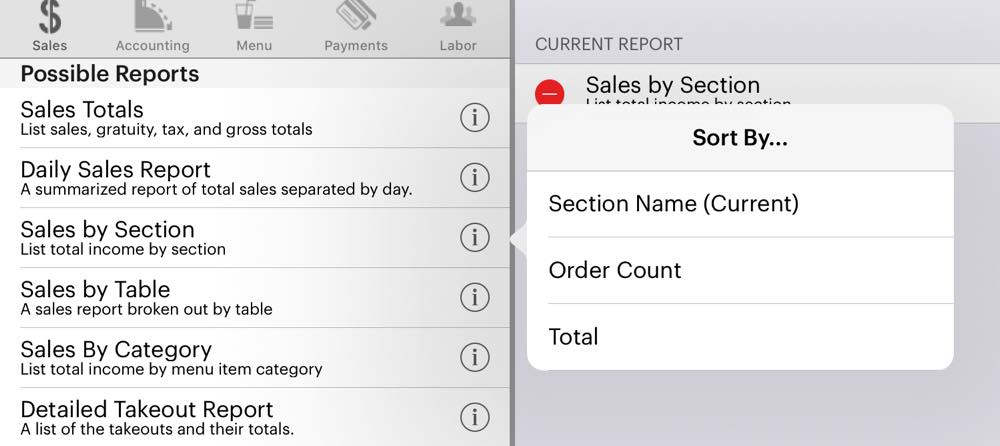
Before you add a Sales by Section report, tap the Information ![]() icon associated with the report to specify the sort order:
icon associated with the report to specify the sort order:
|
Option
|
Description
|
|
Section Name
|
Sorts sales by section.
|
|
Order Count
|
Sort sales by sections with the most number of closed bills (“purchases”).
|
|
Total
|
Sort sections by sections with the highest sales totals.
|
Section 2. How is a Sales by Section Report Generated?
1) Sections

Sections were set under Admin | Admin Settings | Floorplan | Sections. Bills record section and floor details.
Chapter 9. Sales by Table
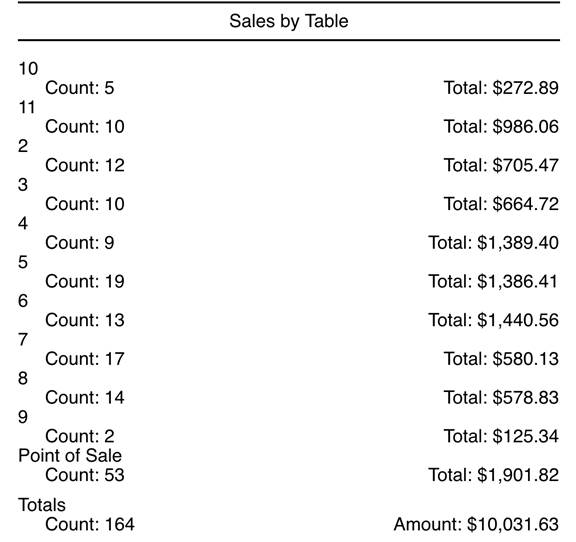
The Sales by Table report gives you sales totals for each table along with the number of closed bills associated with the table. This report will not report sales made at the POS or via Orders. You can use it to detect your best and worst performing tables.
Section 1. How is the Sales by Table Report Generated?
1) Floor Plan

The table numbers represent your table numbers on your floor plan.
2) Closed Bills
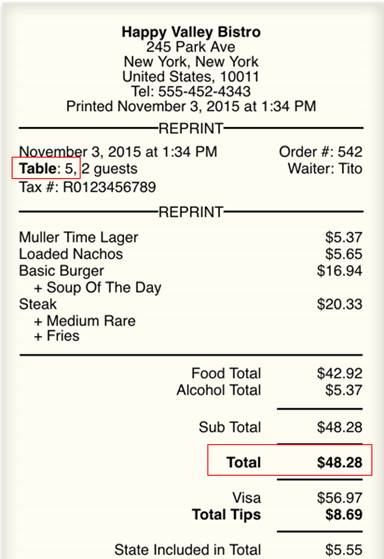
TouchBistro keeps track of tables on guest checks and uses this data to generate the report. Count indicates the number of bills closed at the table.
Chapter 10. Sales by Category
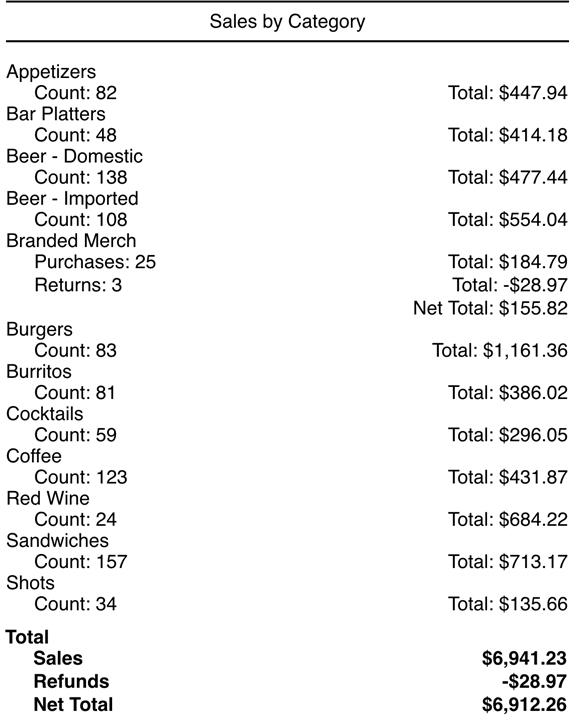
The Sales by Category report gives you a breakdown of the number of closed bills (purchases), returns (refunds), and sales totals for each menu category.
Section 1. Sort by
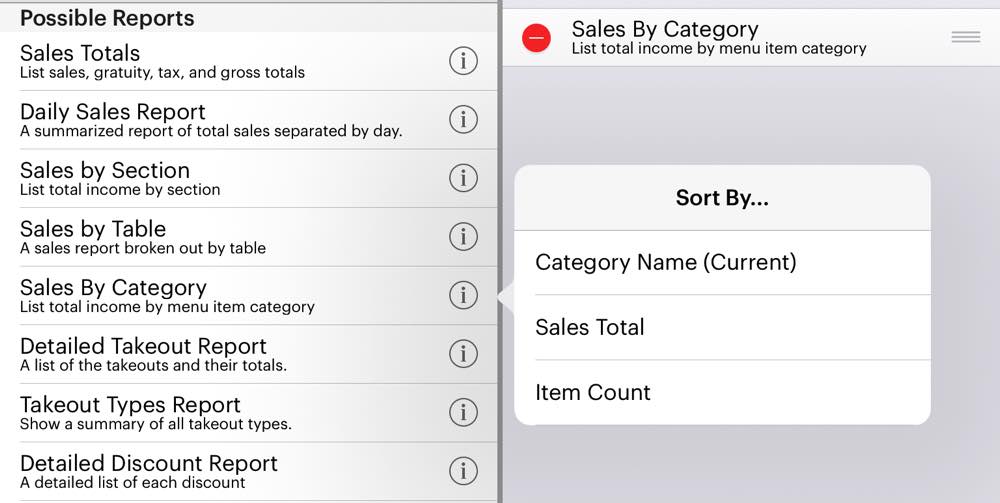
Before you add a Sales by Category report, tap the Information ![]() icon associated with the report to specify the sort order:
icon associated with the report to specify the sort order:
|
Option
|
Description
|
|
Category Name
|
Sorts sales by menu category.
|
|
Sales Total
|
Sort menu categories by categories with the highest sales totals.
|
|
Item Count
|
Sort menu categories by categories with the highest number of items sold.
|
Section 2. How is a Sales by Category Generated?
1) Menu Categories
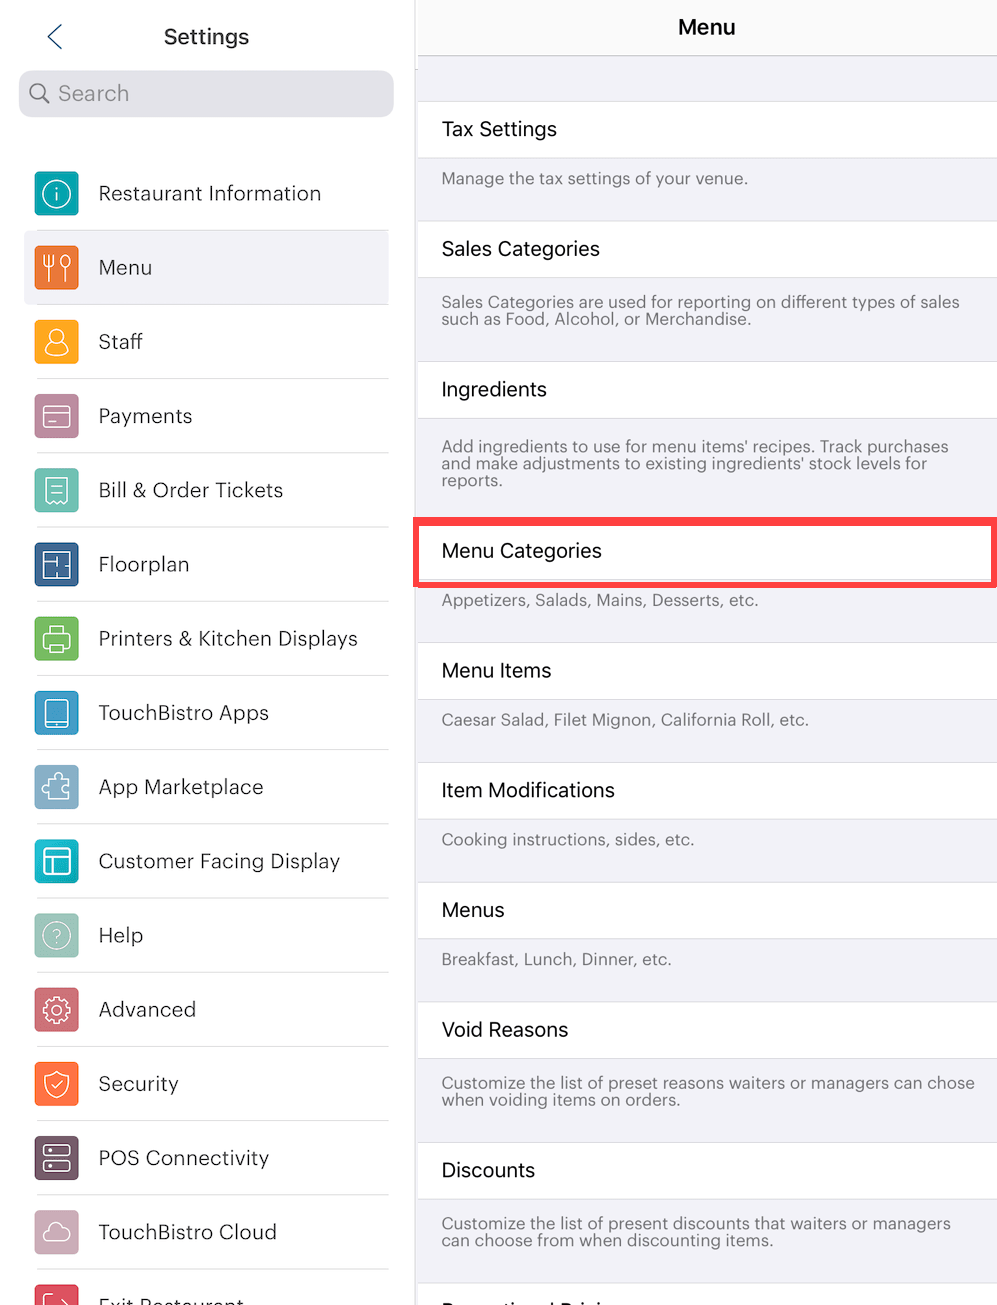
Menu Categories are set up under Admin | Admin Settings | Menu | Menu Categories.
Chapter 11. Detailed Takeout Report
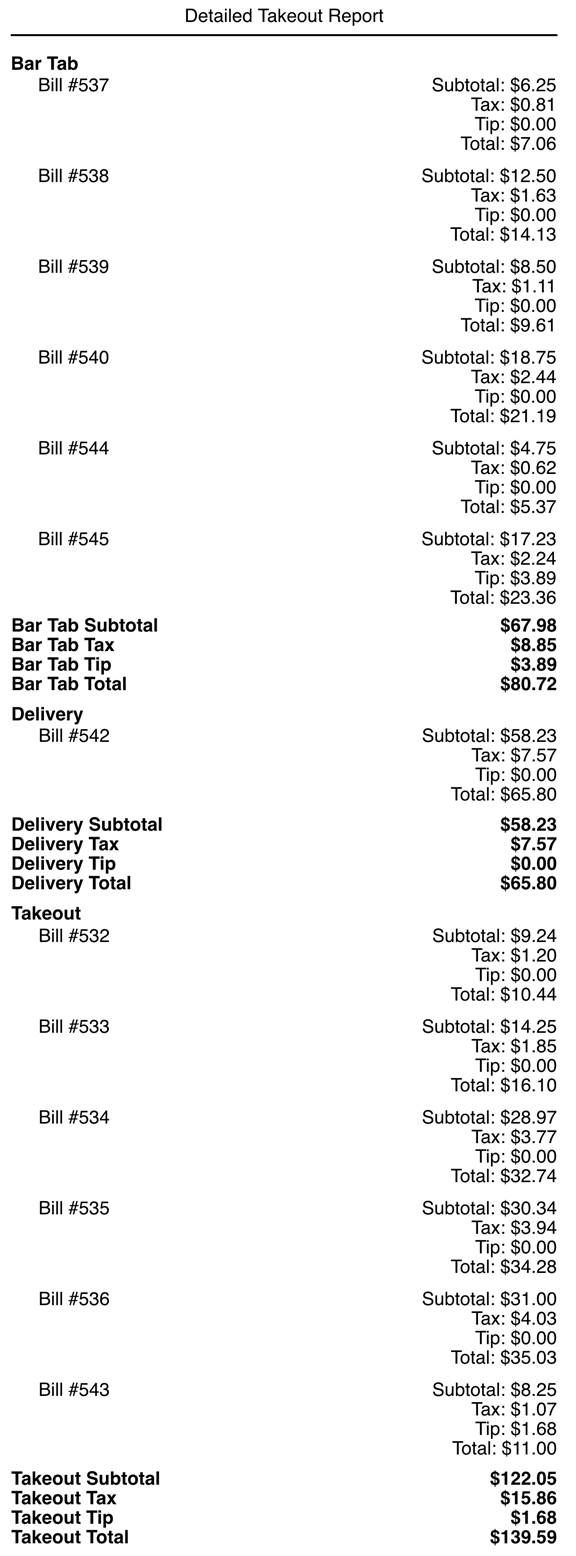
The Detailed Takeout Report reports bills from Orders (Takeout, Delivery, and Bar Tabs). If you’ve created customized takeout types, TouchBistro will report all takeout types as simply Takeout.
Section 1. How is the Detailed Takeout Report Generated?
1) Bill Number
Bill # represents the number TouchBistro assigns to a printed receipt. If you need to look up a bill, access TouchBistro’s Bill / Guest Check History, set the time/date wheels for the same date range as this report, and locate the Bill # in the Search Results area.
2) Subtotal, Tax, Tip

The Subtotal, Tax, and Tip figures come from the bottom of the bill. Tip will only have a value if the tip was left with a credit card.
Chapter 12. Takeout Type Report

If you are using customized takeout types, this report will break down sales by your custom take out types, as well as give you bar and delivery order figures.
Section 1. Sort By

Before you add a Takeout Type Report, tap the Information ![]() icon associated with the report to specify the sort order:
icon associated with the report to specify the sort order:
|
Option
|
Description
|
|
Takeout Types
|
Sort by order type.
|
|
Sales Totals
|
Sort order types from highest to lowest.
|
|
Item Count
|
Sort order type by number of orders, from highest to lowest.
|
Section 2. How is the Takeout Type Report Generated?
1) Takeout Types
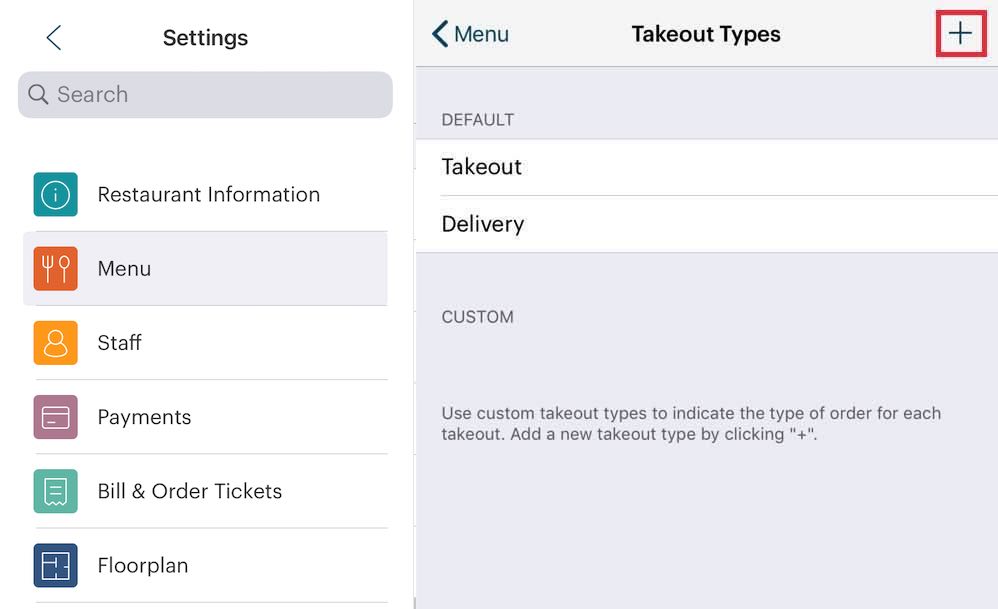
By default, you will see Takeout, and Delivery, and Bar Tab. However, you can create your own customized takeout types under Admin | Admin Settings | Menu | Takeout Types.
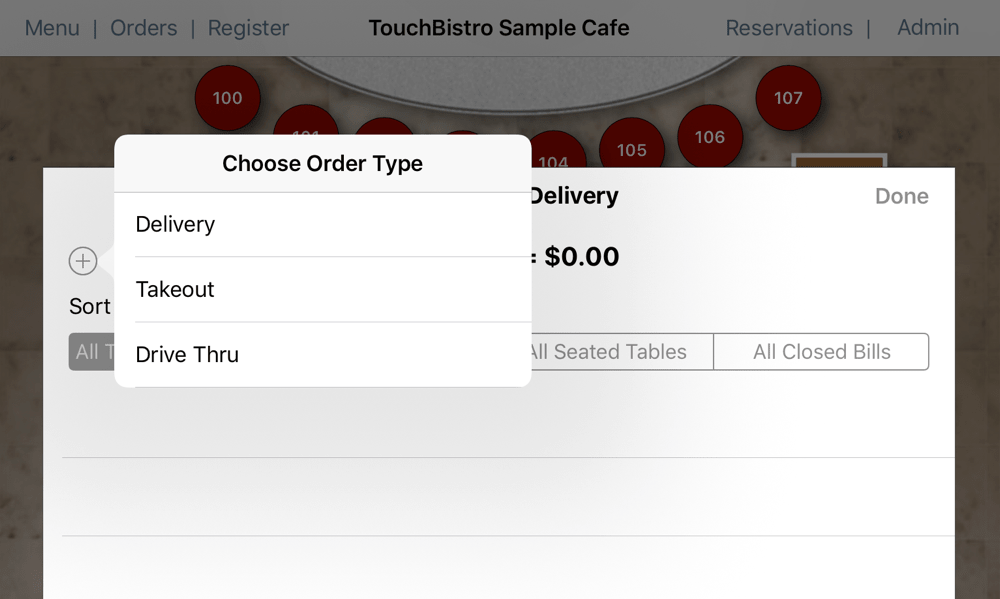
When you create a takeout order, they become available from the All Take-Out/Deliver order tab.
Chapter 13. Detailed Discount Report

The Detailed Discount Report gives a list of discount applied to menu items, who applied the discount, the amount of the discount, and what manager approved the discount (if required).
Section 1. How is a Detailed Discount Report Generated?
1) Promotional Pricing
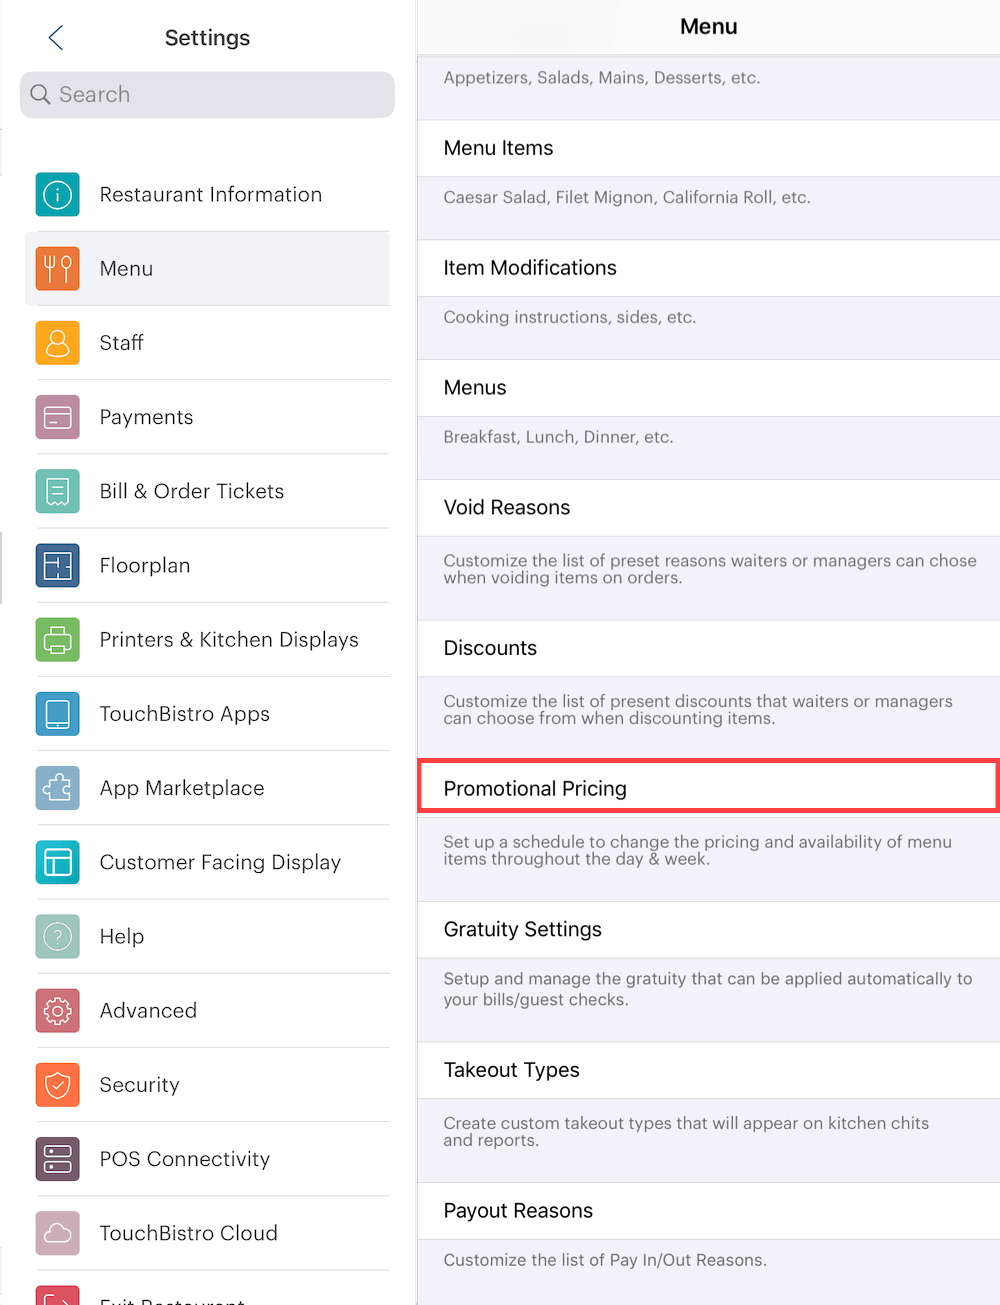
TouchBistro supports various means for the application of discounts. Under Admin | Admin Settings | Menu | Promotional Pricing, you can set up reduced prices on menu items automatically based on time of day settings. For example, you might want to offer appetizers at a 50% discount during a “happy hour” period.
These discounts are applied automatically and do not require manager approval.
2) Discounts

Under Admin | Admin Settings | Menu | Discounts you can create valid discounts a server might be able to apply to a meal.

For example, you might create a discount the server can apply if the customer is inconvenienced in some way (“Fly in soup”). Or you could create a discount where a customer can get a free dessert if it’s his/her birthday.
3) Waiter
Waiter indicates the name of the staff member who requested the discount (that is tapped the Discount option). This could differ from which staff member is reported as opening and closing the table or order if the staff member discounting the item differs.
4) Manager Approval
The Manager item indicates which manager approved the discount (that is enter his/her pass code in the manager confirmation screen). You should not have the manager (or Admin) do the actual discounting him/herself as this may cause reporting inconsistencies.
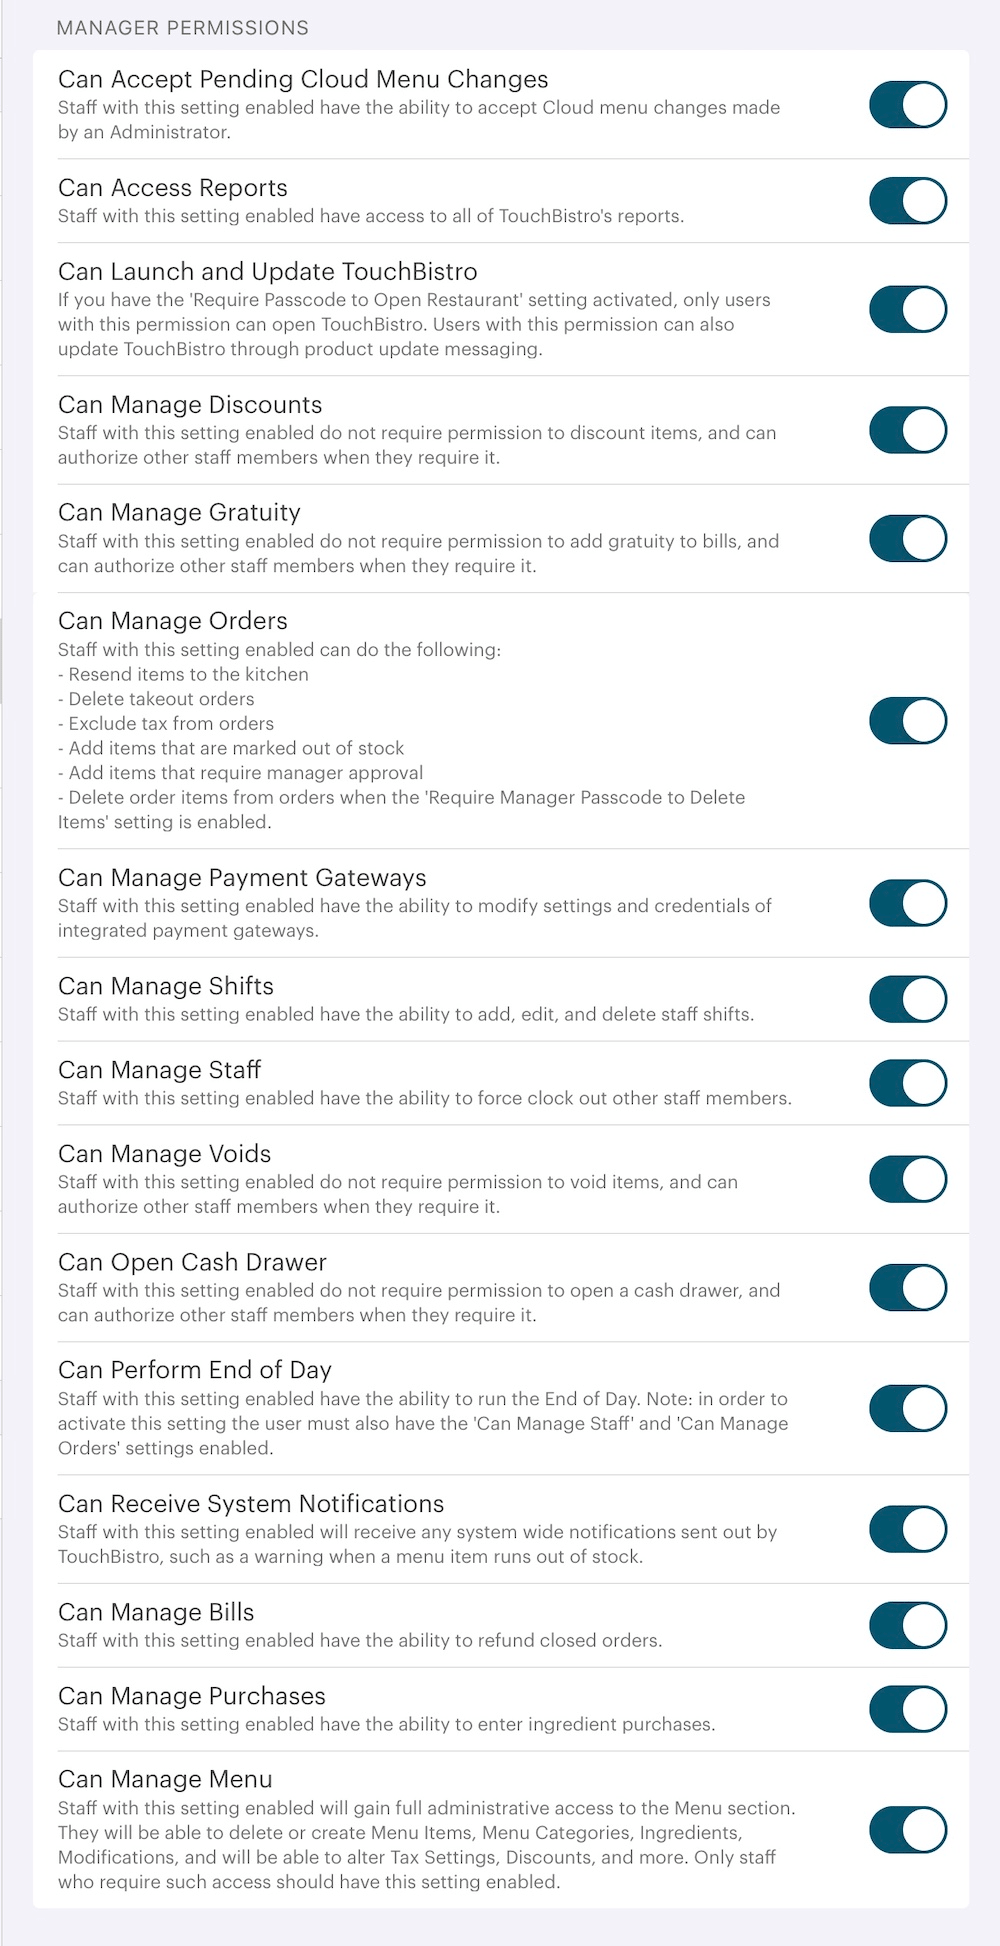
Discount approval rights can be set up by enabling Can Manage Discounts under appropriate Staff Types.
5) Staff Discounts
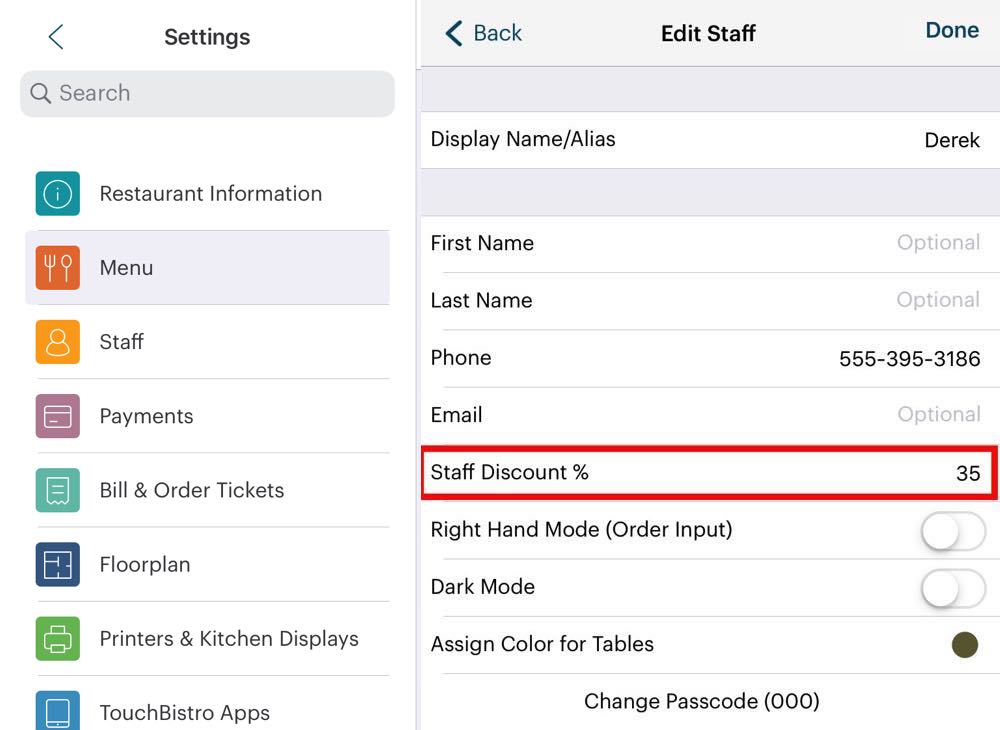
Finally, you can also set up staff discounts under a staff member’s details page. You can set up percentage discounts for staff members.
These discounts require manager approval.
Chapter 14. Discounts Summary
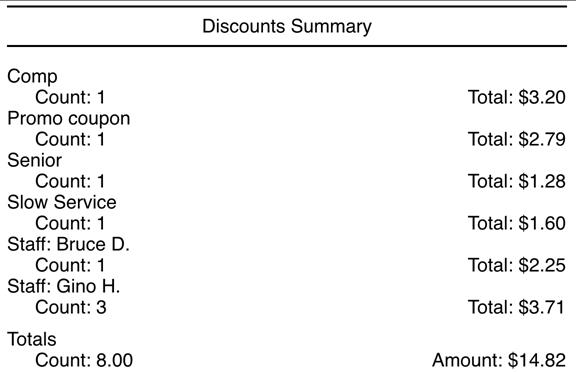
The Discounts Summary report gives you a breakdown of which discounts (regular or staff discounts) are being used, how many discounts have been applied, and the total discount.
Section 1. Sort by

Before you add a Discounts Summary report, tap the Information ![]() icon associated with the report to specify the sort order:
icon associated with the report to specify the sort order:
|
Option
|
Description
|
|
Discount Name
|
Sort sales by discount name.
|
|
Discount Count
|
Sort discounts by usage.
|
|
Total
|
Sort by total amount discounted.
|
Chapter 15. Void Report

The Void Report gives a list of voids issued, the void reason, the amount voided, and the manager who approved the void.
Section 1. How is a Void Report Generated?
1) Void Description

Voids are set up under Admin | Admin Settings | Menu | Void Reasons. You set up valid reasons for the issuing of a void.
Voids are issued on an item by item basis on the Order screen. Items can be deleted before being sent to the kitchen. However, after they are sent they need to be voided. A void requires manager approval.
2) Waiter
Waiter indicates the name of the staff member who requested the void (that is tapped the Void option). This could differ from which staff member is reported as opening and closing the table or order if the staff member voiding the item differs.
3) Manager Approval
The Manager item indicates which manager approved the void (that is enter his/her pass code in the manager confirmation screen). You should not have the manager (or Admin) do the actual voiding him/herself as this may cause reporting inconsistencies.
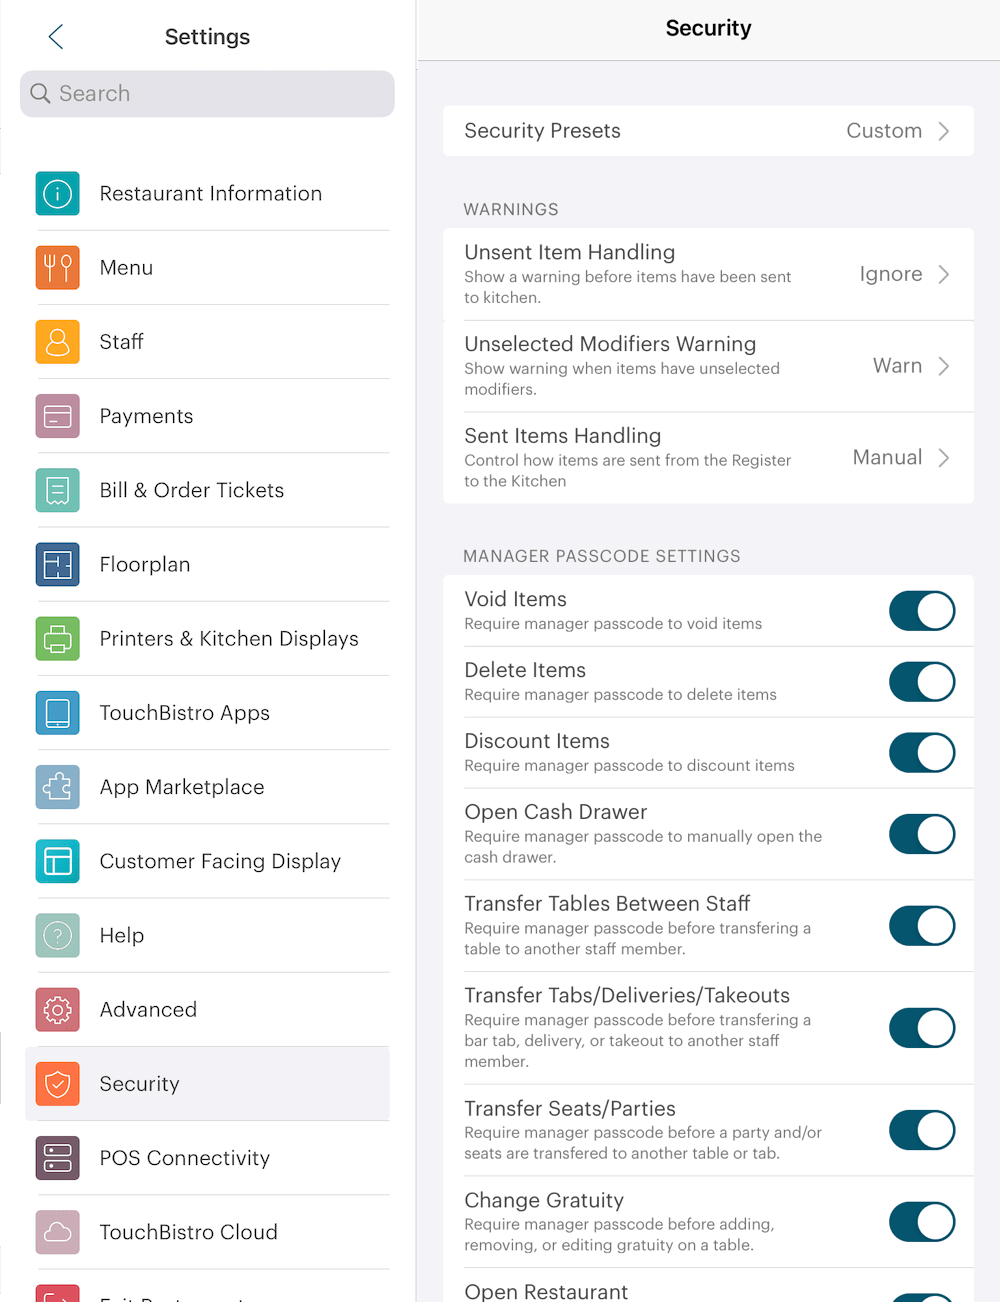
Voids can be set to require manager approval under the Security settings page by enabling Require Manager Passcode to Void Items. If you enable Require Manager Passcode to Void Items staff who do not have void approval rights will need to get a staff member with void approval rights set to enter his/her passcode. Alternatively an Admin can approve a void with his/her passcode.
Void approval rights can be set up by enabling Can Manage Voids under appropriate Staff Types.
4) Taxable/Non-Taxable
If the void is flagged as Taxable, this indicates you still need to remit taxes on the item despite it being voided. For example, a Margarita item was voided as a mistake. However, the Taxable flag indicates you will need to remit the tax on the $7.99 value of the drink to your tax authority. Not all tax jurisdictions require venues to remit taxes on voided items, like alcohol items.

If this is required, the Is Taxable is set up on a per void basis when setting up void reasons.
Chapter 16. Waiter Sales Item Totals

The Waiter Sales Item Totals report gives you a breakdown of which menu items are sold by each staff member, the number of those items, and the total of those sales.
Section 1. Sort by

Before you add a Waiter Sales Item Totals report, tap the Information ![]() icon associated with the report to specify the sort order:
icon associated with the report to specify the sort order:
|
Option
|
Description
|
|
Items Sales
|
Sorts items by sales totals (highest to lowest).
|
|
Item Count
|
Sorts items by count (number sold).
|
|
Item Name
|
Sorts items alphabetically.
|
Section 2. How is a Waiter Sales Item Totals Report Generated?
Closed guest checks record waiter name and items sold.
Chapter 17. Current Snapshot

The Current Snapshot report will show the current business day’s labor costs, a running sales total, a ratio of labor/sales, and tips/voids/discounts. You cannot generate it for more than a day. This report is essentially the same as the Admin | Snapshot report.
Section 1. How is a Current Snapshot Report Generated?
The Current Snapshot report combines key data from several different reports, giving you a snapshot of your sales, food/alcohol costs, tax report, and labor reports.
Chapter 18. Sample CSV Report Download
Click here to download a sample CSV report for the following Sales Reports:
- Sales Totals
- Sales by Section
- Sales by Table
- Sales By Category
- Detailed Takeout Report
- Detailed Discount Report
- Discounts Summary
- Void Report
- Waiter Sales Item Totals
See Also