Cloud Reporting Dashboard and Site Basics
Table Of Contents
Chapter 1. TouchBistro POS App Version Number
Chapter 2. Ensure You have Internet Access
Chapter 4. Adjusting the Reporting Range
Chapter 1. TouchBistro POS App Version Number
Cloud reporting is incompatible with versions of TouchBistro lower than version 7.2.3.
Chapter 2. Ensure You have Internet Access
Before you can access the cloud site and get TouchBistro to upload data, your TouchBistro network’s AirPort router needs to be connected to the Internet. See this page for how to determine if TouchBistro is communicating with the Internet.
Chapter 3. Signing In
Visit Login.TouchBistro.com. Sign in with your TouchBistro User Name (also referred to as your Account Name) and Password. If you’ve lost either or both, see this document.
Depending on browser type (Chrome, Safari, etc.) your browser may try to auto fill the User Name and Password fields. If these were not inputted correctly the first time or your details have changed, your browser may auto fill these incorrectly. You should clear your auto fill details. Each browser has a different method for doing this. This page will help you remove these details for popular browsers.
Chapter 4. Adjusting the Reporting Range
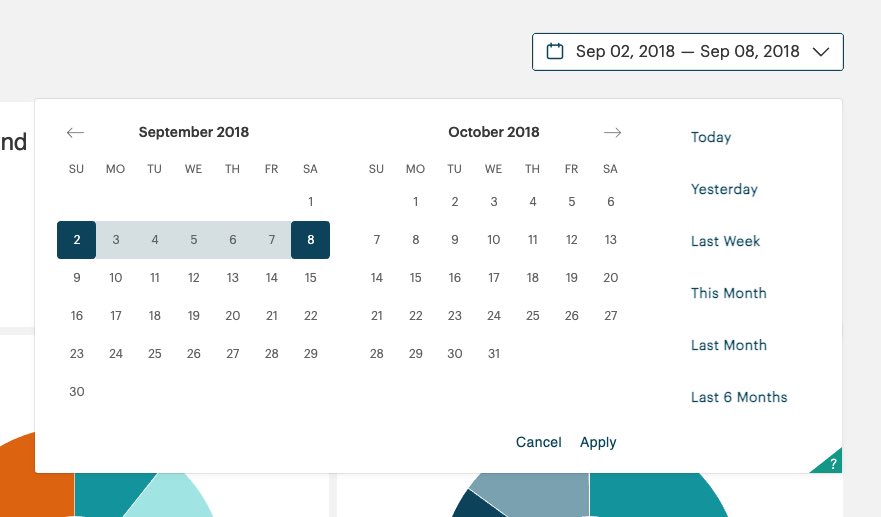
To adjust the day or date range of any cloud report, click the Date Picker in the top right.
|
Range
|
Description
|
|
Today
|
By default, reports from Midnight to Midnight. In other words, if today is November 10, today gets the range from November 10 12:00:01 AM to the end of November 10 as the clock ticks over from November 10 11:59:59 pm to Midnight of November 11. You can set a custom start day under Account Settings.
|
|
Yesterday
|
By default, reports from Midnight to Midnight of the day before.
|
|
Last 7 Days
|
Reports on today plus 6 days previous.
|
|
Last 30 Days
|
Reports on today plus 29 days previous.
|
|
This Month
|
Reports on today and all days in the current month previous to today. For example, if today is Nov 17, the range will be Nov 1-17.
|
|
Last Month
|
Reports on all days in the previous month. For example, if Today is Nov 17, the range will be Oct 1 – Oct 31.
|
|
Custom Range
|
To select a custom range, don’t click on any option on the right of the date picker. Simply select a start date/time and an end date/time. The range maximum is 6 months. If you set the range longer (a year), Cloud Reporting will only report the most recent 6 months.
|
Chapter 5. Specificity
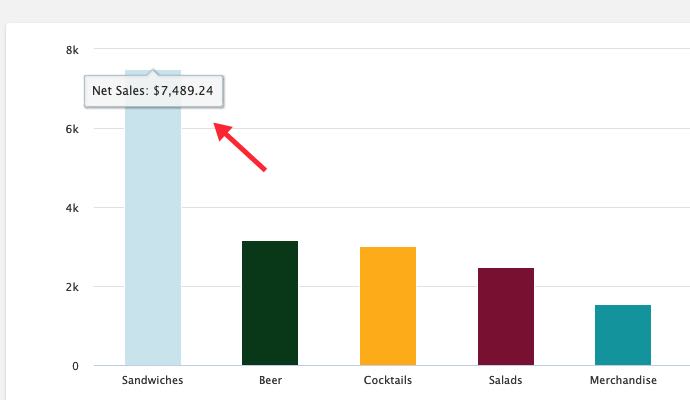
Bar charts usually have a hover feature. If you hover over a specific bar, the cloud page will give you the exact sales figure.
Chapter 6. Currency Symbol
The Cloud Portal will use the currency symbol set by the region setting on the iPad you’re using to run the TouchBistro app. For example, if your TouchBistro iPad’s region is set for the United Kingdom, Cloud Reporting will display your sales figures with the £ symbol. If you are in the UK and you’re not seeing a £ symbol, click here for troubleshooting steps.
Chapter 7. Search
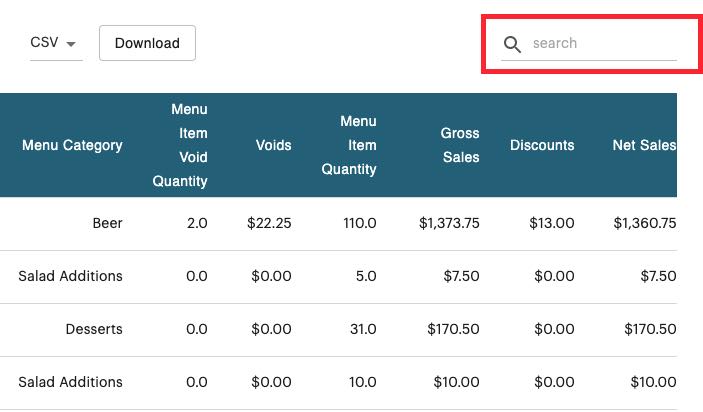
Many reports have a Search dialog box. You can use this dialog to filter results based on a key term.
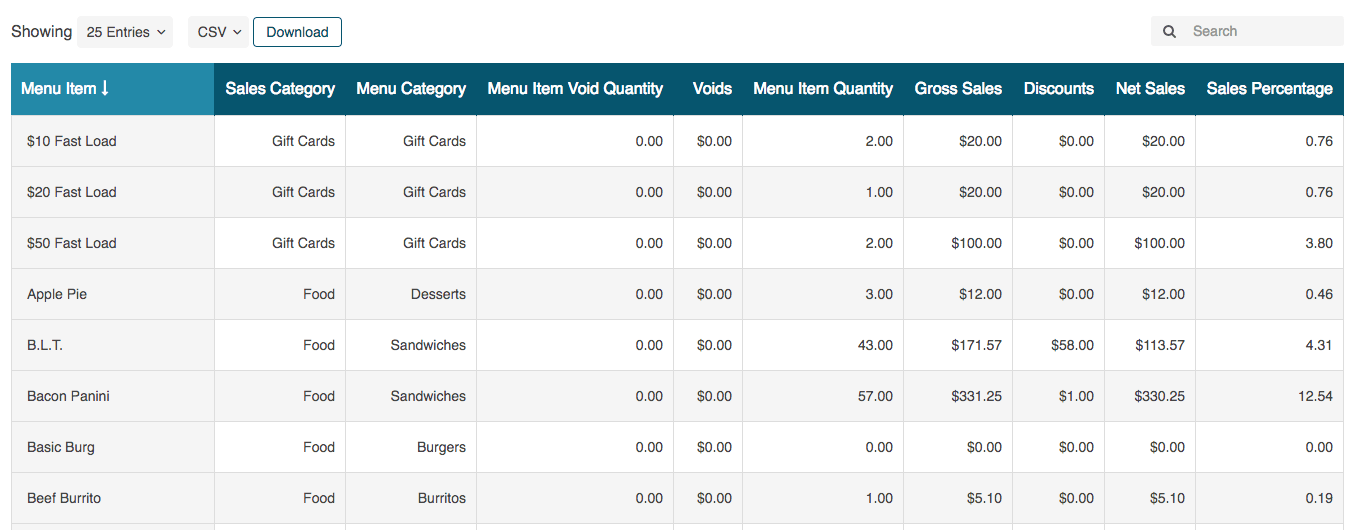
For example, the Items report can potentially give you a long list of items sold.

However, if you’re only interested in burgers, you can enter “burger” in the search dialog box and quickly filter the list to any item that contains “burger”.
Chapter 8. Dashboard
Section 1. Dashboard
The Dashboard will give you a snapshot look at sales data for a particular day or for a specified seven-day period. Click the Date Picker in the top right to select another day or a desired week.
Dollar values are before tax. Tips represents tips left on credit cards and cash tips if you have servers report their cash tips upon clock out. If you have set auto grats to be treated differently from tips, the Gratuities figure represents both credit card and cash autograts.
Dollar values under Tender Types include tax and tips (if the tender type is a credit card). Cash will only include auto grats if auto grats are set in TouchBistro to be treated differently from tips.
If you need to find the average spend for a range greater than a week, you can use the iPad Statistical Summary report.
Section 2. Weekly Targets
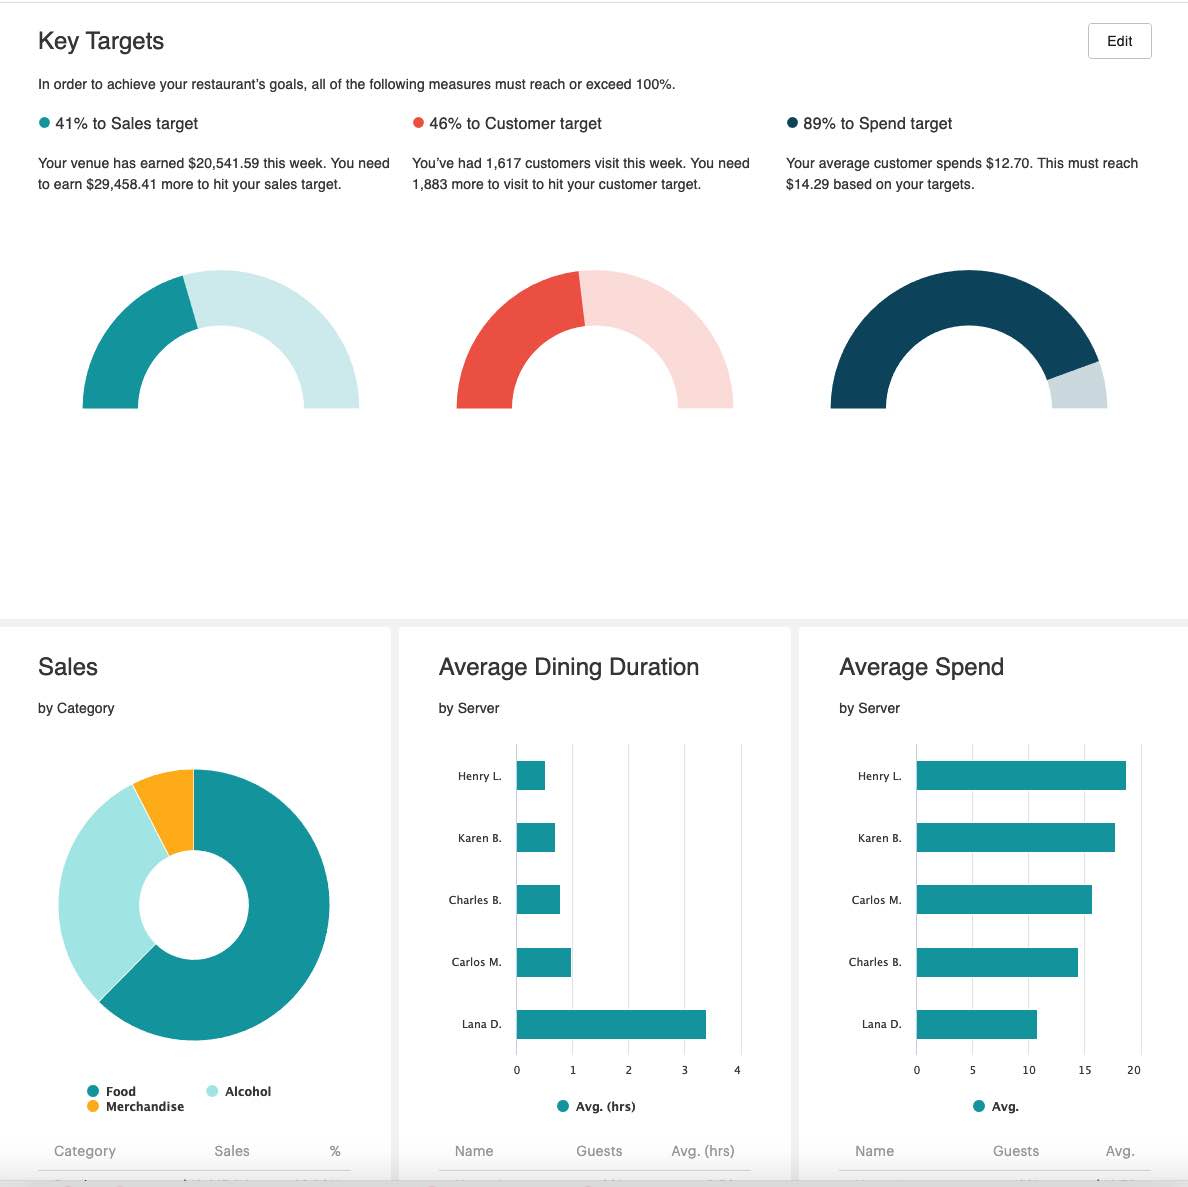
The Weekly Targets dashboard gives you a look at a week (either completed or your current week). If your week has yet to be completed, the Key Targets section will show you how close you are to hitting sales and customer numbers you specify.
Dollar values are before tax. Tips represents tips left on credit cards and cash tips if you have servers report their cash tips upon clock out. If you have set auto grats to be treated differently from tips, the Gratuities figure represents both credit card and cash auto grats.
Dollar values under Tender Types include tax and tips (if the tender type is a credit card). Cash will only include auto grats if auto grats are set in TouchBistro to be treated differently from tips.
1) Setting Targets
To set a weekly target, click the Edit button.
Enter a dollar value for the weekly sales target and the number of actual customers (covers). The Spend Target assumes if you achieve your customer target, how much each of those customers must spend to hit your sales target.
Click Save to save the values entered.
Chapter 9. Sample CSV Report Download
Many of the cloud reports can be downloaded in CSV format. Click here to download a sample CSV report for the following cloud reports:
Sales Totals
Sales by Section
Sales By Category
Sales By Category
Detailed Discount Report
Discounts Summary
Void Report
Waiter Sales Item Totals
Tax Report
Sales Item Totals
Food Cost Report
Alcohol Cost Report
Payment and Refund Totals
Payments by Section
Detailed Credit Card Payment Report
Detailed Credit Card Refund Report
Detailed Shift Report
Cash Tip Report
Credit Card Tips Report
Waiter Tip Summary
Deleted Items Report
Chapter 10. Using TouchBistro Reports To Go
The TouchBistro Reports To Go app lets you easily access your reports on your smartphone or tablet using a simple, intuitive interface. If you are using an iPhone or iPad, you can download it from the App Store. If you are using an Android device, you can install via Google’s Play Store.
Tapping the Reports To Go icon will prompt you to log in to your TouchBistro account.
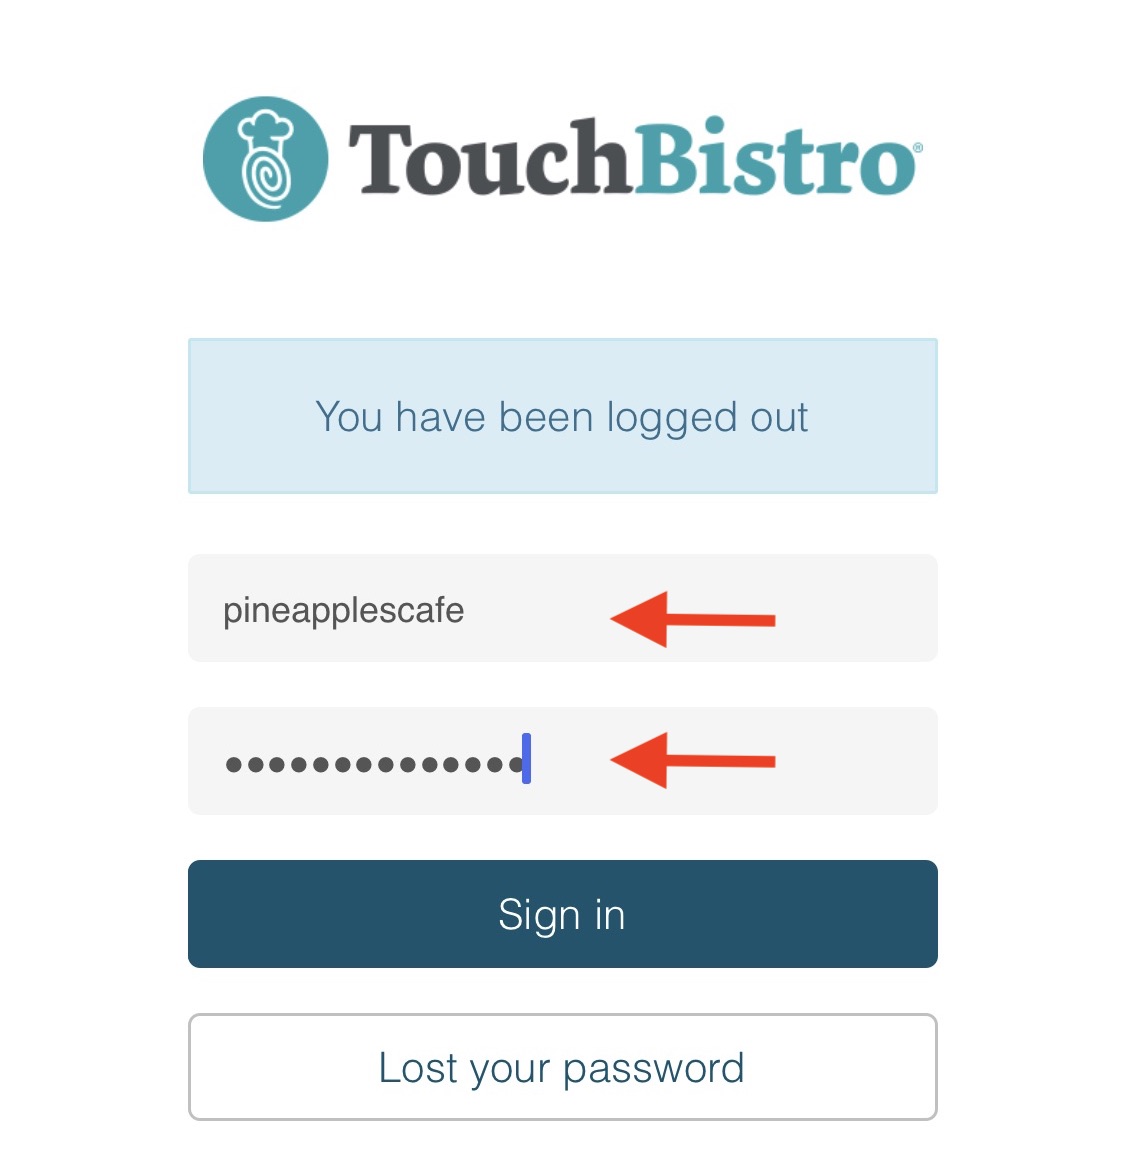
Enter your TouchBistro username and password and tap Sign In.
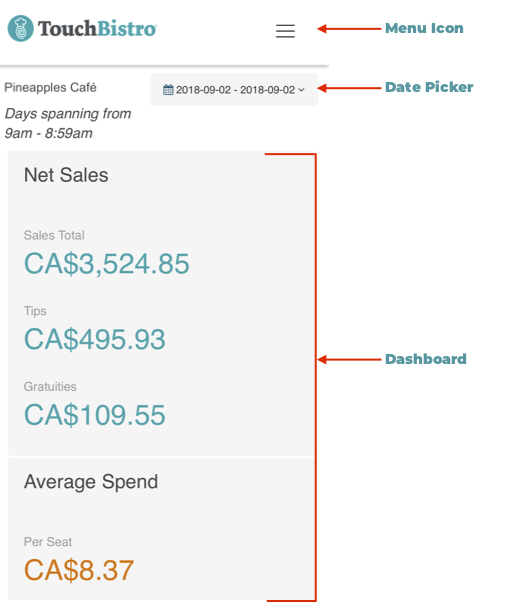
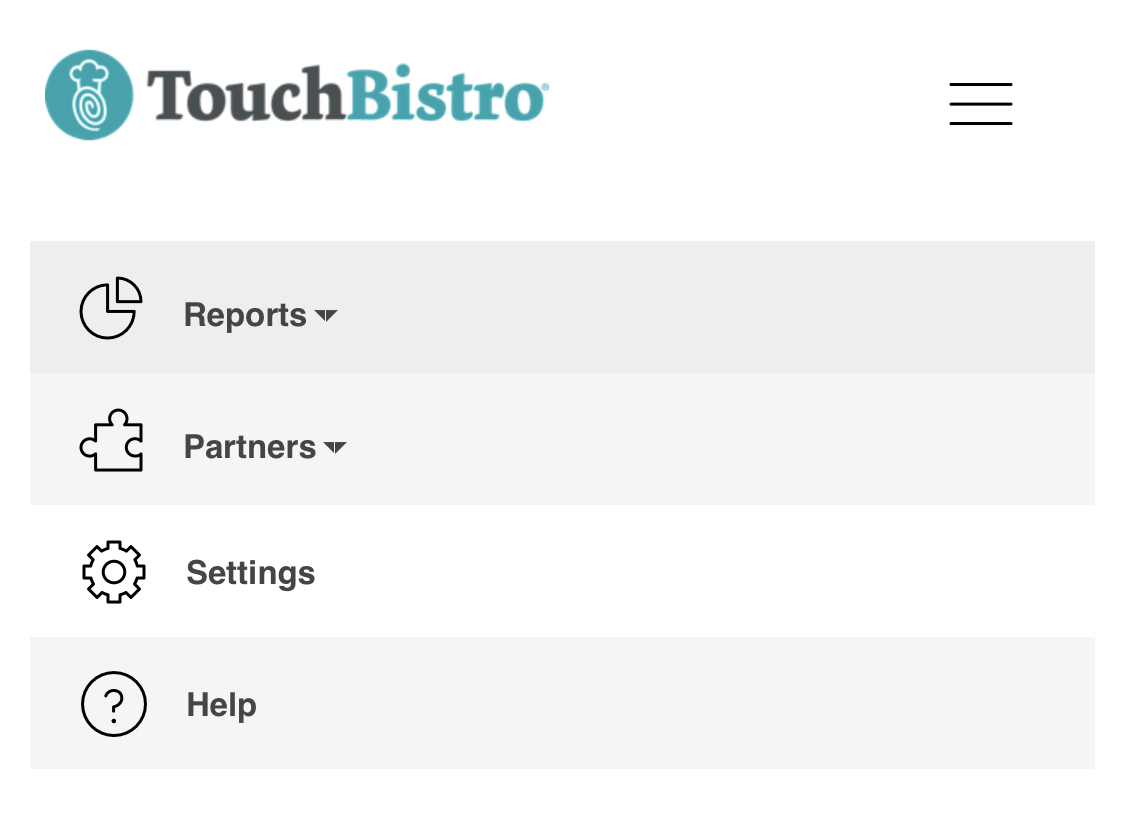
The Menu Icon in the top left-hand corner allows you to navigate to each of your Reports, as well as access other Cloud features and preferences, such as Partners, Settings, and Help.
The Date Picker allows you to specify the date, or date range you wish to report on. The Sales Dashboard will give you a snapshot look at sales data for a particular day or for a specified seven day period.
Essentially, most of the functionality you find when you log into Login.TouchBistro.com on your computer is available to you via Reports To Go on your smartphone or tablet. Remote Menu Management, and Pro Server application download, are not available via Reports To Go.
See Also


 Email
Support
 Frequently
Asked Questions