Sales Reports
Table Of Contents
Chapter 2. Gross Margin by Day
Chapter 3. Heat Map/Time of Day/Bill Start Time
Chapter 4. Sales by Menu Category
Chapter 6. Sales by Order Type
Chapter 1. Drill Down
The Drill Down report gives you an hour-by-hour breakdown of pre-tax/post-discount sales or quantity sold by Section, Sales Category, Menu Category, and/or Menu Item. Use the checkboxes at the top to indicate how you want sales grouped. Use the Display drop-down to switch from net sales to a report of quantity sold for each hour. Use the Net Sales/Quantity drop-down box to display the report by sales or items sold. Use the Bill Start Time drop-down box to switch between figures reflecting when the bill was started or when the bill was closed.
You can download this report as a CSV by clicking the CSV icon at the top of the report chart.
Chapter 2. Gross Margin by Day
Gross Margin by Day represents before tax sales totals and do not include gratuity. It also provides a gross margin based on labor and food costs. You can download this report as a CSV by clicking the CSV icon at the top of the report chart.
At the top, a bar chart gives you a visual indication of sales over the selected reporting range (for example, the last 7 days).
The By Day report shows you exact sales totals by day. You can sort by:
|
Column
|
Description
|
|
Day of the Week
|
A day (for example, Sunday).
|
|
Bill Count
|
The number of bills closed for that day.
|
|
Voids
|
The value of voids (items voided after they were sent to the kitchen) authorized by a manager or admin. Void values do not factor into Gross Sales, Discounts, or Net Sales calculations.
|
|
Gross Sales
|
The sales totals (pre-tax, does not include gratuity) for the day. The Gross Sales total includes items at their pre-discount price. For example, if you sold one item for the day at $20 and then discounted it by $5, Gross Sales would report $20.
|
|
Discounts
|
The value of discounts and promotions. For example, if you sold one item for the day at $20 and then discounted it by $5, Discounts would report $5. |
|
Net Sales
|
The sales total for day less discounts. For example, if you sold one item for the day at $20 and then discounted it by $5, Net Sales would report $15. |
|
Menu Item Cost
|
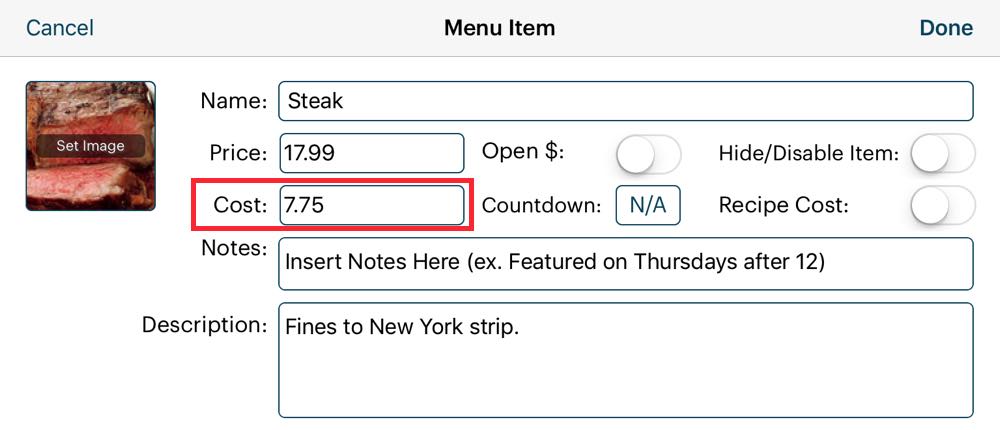
A total of all items sold based on their Menu Item Cost setting.
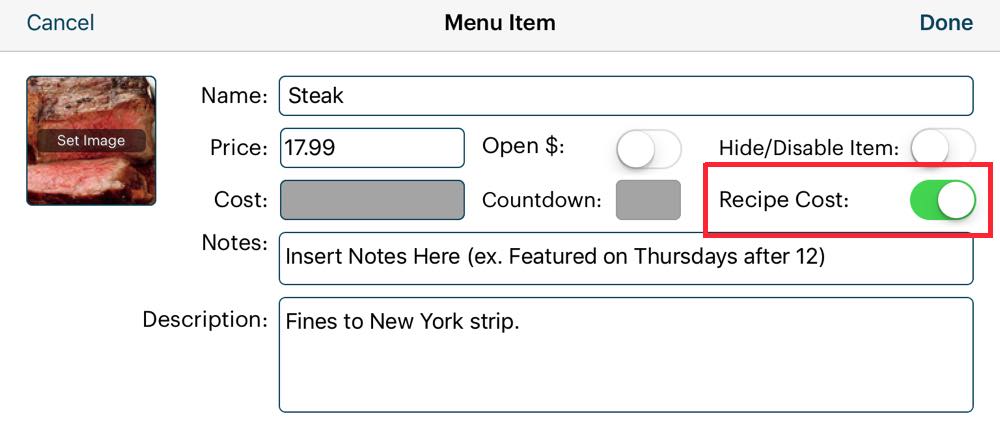
If you are using the Recipe Cost method (using the Ingredient Inventory system), Menu Item Cost will use your menu item recipe to calculate the cost.
|
|
Labor Cost
|
The day’s labor cost. This figure will be the same as the Labor Cost figure in the Hours Summary report.
|
|
Margin
|
The gross margin: net sales less the menu item cost and the labor cost. Note: This figure will not be accurate until your staff members have all signed out, giving you an accurate labor cost report. You should not use the Gross Margin by Day report for real-time reporting.
|
Chapter 3. Heat Map/Time of Day/Bill Start Time
The Time of Day report gives you a “heat map” at the top. The Time of Day heat map gives you a visual representation of pre-tax/post-discount sales totals for each hour of each day over the given reporting range. The heat map can be useful for staffing, understanding your core hours. This report uses the bill’s close time. If you prefer to use the bill’s start time, use the Bill Start Time report.
The By Day table gives you totals for each day over the given reporting range. You can sort by:
|
Column
|
Description
|
|
Net or Gross Sales
|
Total sales for that day over the given reporting range. The Time of Day heat map will give you Net Sales (sales less discounts). The Bill Start time heat map will give you Gross Sales (before discounts).
|
|
Bill Count
|
Number of bills closed.
|
|
Min
|
The minimum bill closed.
|
|
Max
|
The maximum bill closed.
|
|
Average
|
The average bill.
|
Chapter 4. Sales by Menu Category
Sales by Menu Category gives before tax sales totals of your menu categories for the given date range. You can download this report as a CSV by clicking the CSV icon at the top of the report chart.
The By Menu Category table gives you sales figure for each menu item. You can sort by:
|
Column
|
Description
|
|
Menu Category
|
Your configured menu categories (“mains”, “appetizers”, etc.)
|
|
Voids
|
The value of voids (items voided after they were sent to the kitchen) authorized by a manager or admin in this category. Voids are not reflected in any sales figures. Typically voids are accounted for as waste.
|
|
Gross Sales
|
The before taxes sales total for each menu item in the category. Totals do not include tax and gratuity. If items in the category were discounted, Gross Sales represents the pre-discount amount paid. The total also does not represent voids.
|
|
Discounts
|
If any menu items in this category were discounted (via a discount or a promotion), the total amount discounted is given here.
|
|
Net Sales
|
The net sales total for each category less discounts. Totals do not include tax and gratuity. If items in the category were discounted, Sales totals represent the post-discount amount paid.
|
|
Menu Item Costs
|
The cost of the menu items sold under this category. Costs are determined by the food cost you inputted for the menu item or, if you’re using the Ingredient Inventory system, then according to the item’s ingredient recipe. Costs will not include voided items.
|
|
Menu Item Quantity
|
The actual number of items ordered and billed within that category. This does not include voided items.
|
Chapter 5. Sales by Menu Item
Sales by Menu Item gives you your per menu item sales over the given reporting range. You can download this report as a CSV by clicking the CSV icon at the top of the report chart.
The By Menu Item table gives you sales figures for each menu item. You can sort by:
|
Column
|
Description
|
|
Menu Item Name
|
Name of the menu item.
|
|
Sales Category
|
Your configured sales categories. By default, you will have food and alcohol categories but you might have set up additional categories like “Merchandise” or “Game Rentals”.
|
|
Menu Category
|
Your configured menu categories (“mains”, “appetizers”, etc.)
|
|
Menu Item Void Quantity
|
The number of times the item has been voided.
|
|
Voids
|
Total voids in dollar amounts authorized for each menu item.
|
|
Menu Item Quantity
|
The number of times this item has been ordered. This does not include voided items.
|
|
Gross Sales
|
The before taxes sales total for each menu item. Totals do not include tax and gratuity. If the item was discounted, Gross Sales represents the pre-discount amount paid. The total also does not represent voids.
|
|
Discounts
|
If any menu item was discounted (via a discount or a promotion), the total amount discounted is given here.
|
|
Net Sales
|
The net sales total for each menu item less discounts. Totals do not include tax and gratuity. If the item was discounted, Net Sales totals represent the post-discount amount paid.
|
|
Sales Percentage
|
What percentage of total sales this menu item represents.
|
Chapter 6. Sales by Order Type
The Order Type report gives you sales by orders type (takeout, delivery, bar tab, or dine-in). Sales data represents before tax totals and do not include gratuity. If any discounts or promotions were applied, they represent the discounted price. You can download this report as a CSV by clicking the CSV icon at the top of the report chart.
Section 1. Grouped vs Stacked
You have an option to display the bar charts as either Grouped (individual order types represented by their own bar) or Stacked (order types are stacked by day).
Click the appropriate radio button to select the bar chart type.
You can also filter on order types to display on the bar chart. Click the radio button to add/remove an order type.
The By Day table gives you sales figure for each order type. You can sort by:
|
Column
|
Description
|
|
Day
|
A specific day.
|
|
Take Out
|
Before tax sales figures for take-out orders over the given data range.
|
|
Delivery
|
Before tax sales figures for delivery orders over the given data range.
|
|
Bar Tab
|
Before tax sales figures for bar tab orders over the given data range.
|
|
Dine-In
|
Before tax sales figures for tableside orders over the given data range.
|
|
Online Order
|
Before tax sales figures for online orders over the given data range. If you are not using online ordering you will see $0 figures.
|
|
Total
|
Click to sort from highest to lowest or lowest to highest sales total for the day.
|
Chapter 7. Sales by Sales Category
Sales by Sales Category gives before tax sales totals of your sales category over the given date range. You can download this report as a CSV by clicking the CSV icon at the top of the report chart.
The Sales by Sales Category table gives you sales figure for each Sales Category. You can sort by:
|
Column
|
Description
|
|
Voids
|
The value of voids (items voided after they were sent to the kitchen) authorized by a manager or admin in this category. Voids are not reflected in sales figures.
|
|
Gross Sales
|
The sales totals (pre-tax, does not include gratuity) for the Sales Category. The Gross Sale total includes items at their pre-discount price. For example, if you sold one item in the Alcohol category for the day at $20 and then discounted it by $5, Gross Sales would report $20.
|
|
Discounts
|
The value of discounts and promotions for the Sales Category For example, if you sold one item in the Alcohol category for the day at $20 and then discounted it by $5, Discounts would report $5. |
|
Net Sales
|
The sales total for day less discounts for the Sales Category. For example, if you sold one item in the Alcohol category for the day at $20 and then discounted it by $5, Net Sales would report $15. |
|
Menu Item Costs
|
The cost of the menu items sold in that Sales Category. Costs are determined by the food cost you inputted for the menu item or, if you’re using the Ingredient Inventory system, then according to the item’s ingredient recipe. Costs will not include voided items. |
|
Menu Item Quantity
|
The total number of items sold in that Sales Category. This will not include voided items.
|
|
Tax 1/2/3
|
These will not display as your tax names. These columns indicate taxes collected by tax type for each sales category.
|
Chapter 8. Sales by Section
The Sales by Section report gives you sales by your floor plan sections, plus your cash register, and sales under Orders (takeout, delivery, bar tabs). Sales data represents before tax totals and do not include gratuity. You can download this report as a CSV by clicking the CSV icon at the top of the report chart.
You can also filter out sections by clicking on the sections associated radio button. For example, you might want to filter only on floor plan sections, removing orders and cash register sales.
The By Section table gives you sales figure for each section. You can sort by:
|
Column
|
Description
|
|
Section
|
Name given to the floor plan section.
|
|
Bill Count
|
Total number of bills closed in this section.
|
|
Voids
|
Total value of voids authorized under this section.
|
|
Discounts
|
Total value of discounts given under this section.
|
|
Net Sales
|
Sales, before taxes, for this section.
|


 Email
Support
 Frequently
Asked Questions


